Brightcove Social provides several reports that can be used to monitor the performance of your videos that are posted to your social media accounts:
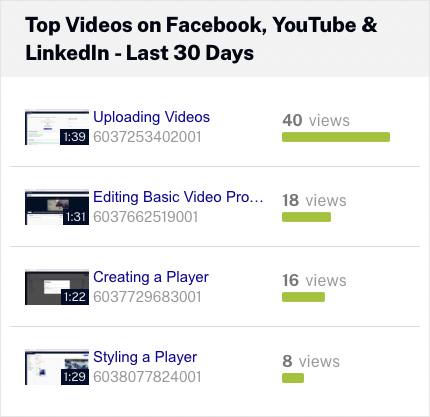
- Dashboard - Provides a high level overview of video performance on social media accounts. Covered in this topic.
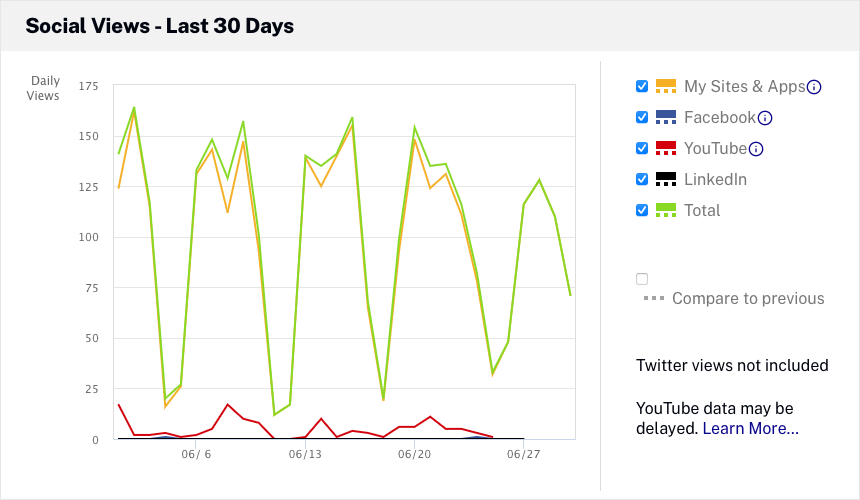
- Social Views - Provides an overview of the social view for videos shared to social media accounts. For information, see Reviewing Social Views Analytics.
- Social Engagement - Provides an overview of the social engagement (Likes, Shares, Retweets, etc.) for videos shared to social media accounts. For information, see Reviewing Social Engagement Analytics.
To access the social analytics, open the Social module and click Social Analytics in the left navigation.
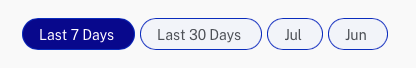
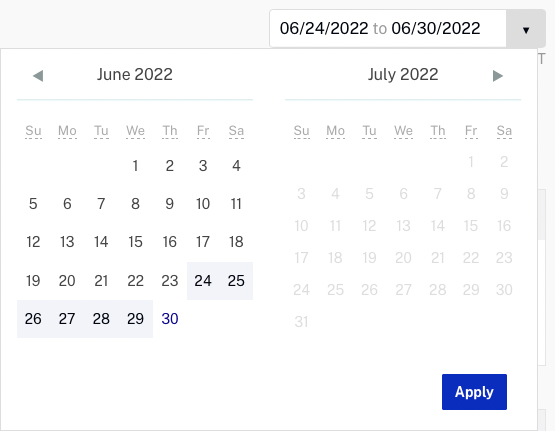
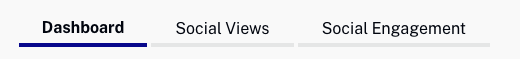
Start by selecting a time span. To select a report, click a tab at the top of the page. The dashboard is displayed by default.
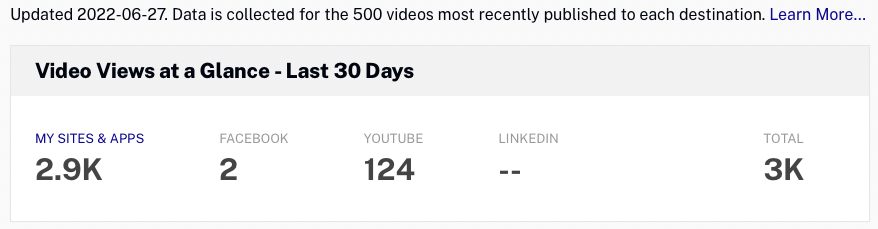
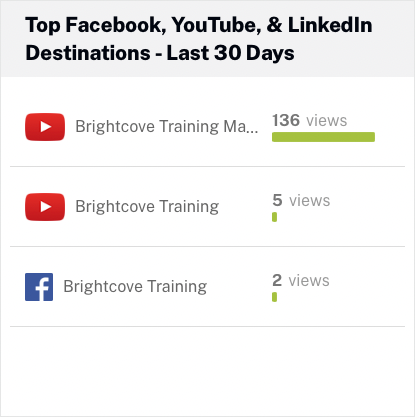
The Dashboard is organized into the following sections: