In this topic you will learn about the NextGen Live analytics that are provided by the Live module.
Overview
The Live module provides reports on live streaming channel or channel performance. Information including real-time concurrent viewers and aggregated post-channel data about the viewer's stream time, geography, and devices are available.
To view live analytics, follow these steps:
Open the Live module.
Click on the three dots for more options.
Click Live Media Asset from the dropdown.
Click in the Analytics tab.
The analytics dashboard is organized into the following sections:
Video Views - Total number of views over the duration of the live stream.
Video Impression - The number of times a video thumbnail or preview is displayed to viewers.
Completion Rate - The percentage of viewers who watch a video from start to finish.
Viewed Minutes - The total amount of time measured in minutes that users spent watching the live stream.
Engagement Score - A metric that measures how engaged an audience is with a video.
Play Rate - The percentage of times a video is played compared to how often it is viewed.
Unique Viewers - Total number of unique viewers watching the stream. For example, if the same user connects to the live stream two separate times within an hour, they would count as 1 unique viewer.
Engagement
A graph displaying the engagement will be displayed below the Snapshot. The engagement measures the number of sessions connected to the stream at any given time regardless of position. For example, if 10 users are watching the live stream at the live edge and 5 users are watching in the DVR window (10 minutes behind live) the concurrent viewers for the minute will be 15 users.
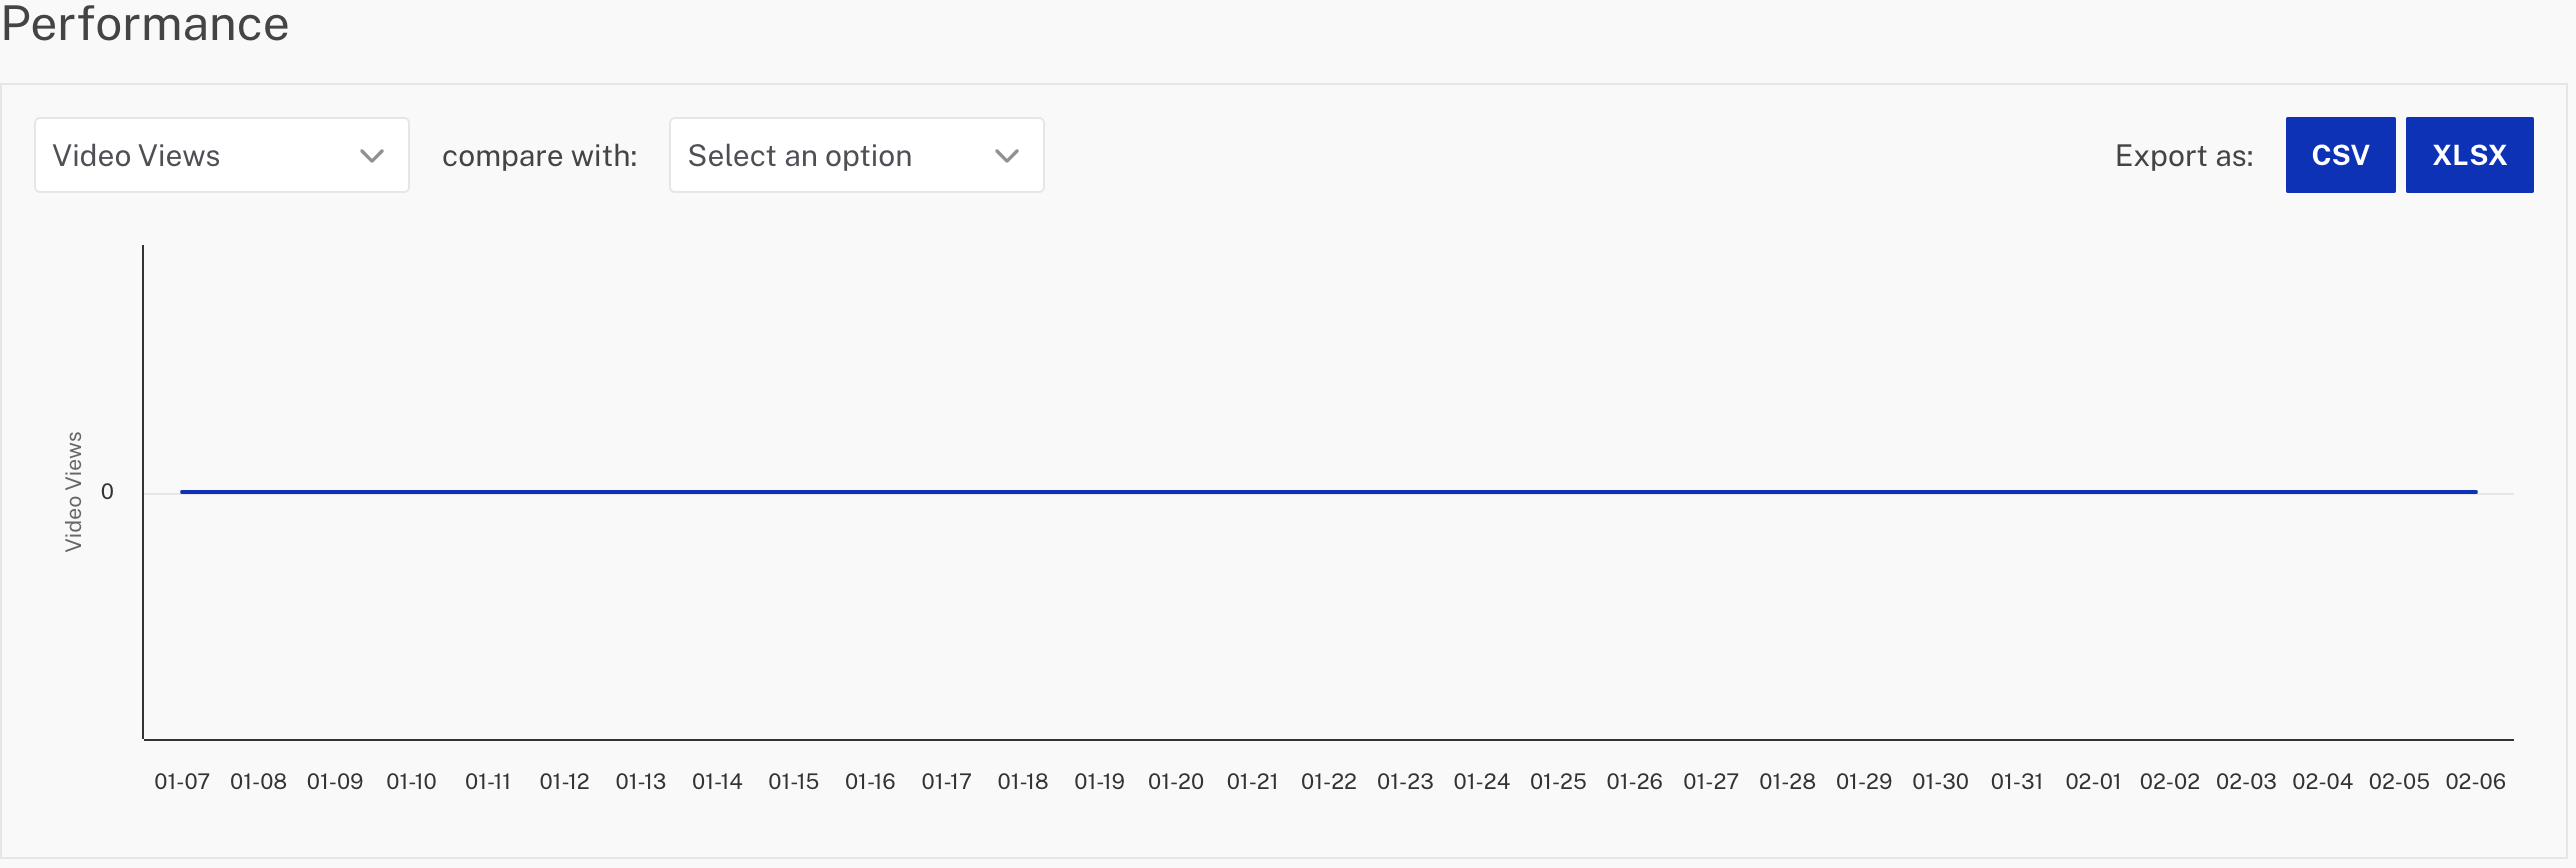
Performance
A dynamic graph will be displayed where you can compare data to determine the performance of your live stream.
Performance and Engagement
You can determine the engagement and performance of your live stream by country, device, player, viewer, and display domain.
Exporting report data
The live channel report data can be exported to a Microsoft Excel file by clicking on the XLSX button.
Notes
General notes related to live analytics:
Analytics are recorded for the default live video ID generated with a Live channel. If a customer takes the m3u8 playlist for playback, or creates a remote asset with it (a new video ID), the analytics won't be collected for the new asset.
Only Concurrent Viewers will be presented in real-time; other metrics will be collected and aggregated with a delay similar to standard analytics
Concurrent Viewers is only accurate for streams that are delivered with the Brightcove Player and SDKs (or non-Brightcove Players using the Brightcove Data Collection API)
Data will be available for up to 32 days after the channel
Real-time is defined by the aggregated sessions over a one-minute interval
With recurring channels, analytics will be provided from the start of the most recent activation
At the moment, the analytics module cannot fetch the precise "unique viewer" data and has a discrepancy between LIVE module analytics. Please use the Reporting UI to confirm the number of viewers.
Certain ad blockers will prevent Live analytics data from loading properly, as shown below:
Ad Blocker Blocks Analytics Data
Disabling the ad blocker should resolve the issue.