{{ page.title }}

{{ page.description }}

The Core reports are a series of reports that show interaction data rolled up by video (project) or by viewer. They show which videos are most engaging and which viewers are most engaged.

The following Interactivity reports are also available:

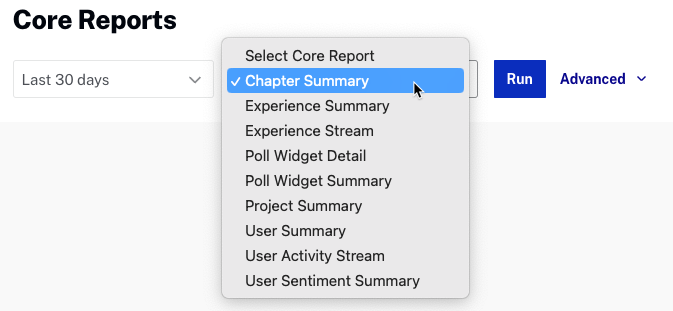
The Core reports can be viewed by opening the Analytics module and then by clicking the Interactivity > Core Reports link in the left navigation.

Performance Report

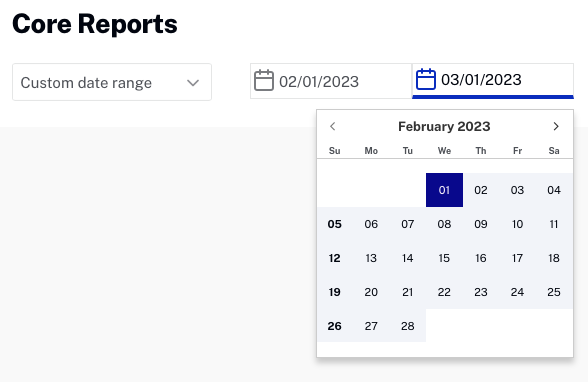
Use the date selector to specify the time period for the report, you can select a fixed date range or select a custom date range.

date selector

Click Run to run the report. Click Advanced to filter the report results by Project or Experience ID. A single ID or a comma separated list is supported.

All of the reports offer the ability to download the report data by clicking download Performance Report .

A summary of each of these reports is described in the following sections.

Chapter Summary

The Chapter Summary report displays all projects with chapters. The report will display:

Performance Report

Experience Summary

The Experience Summary report displays one row per experience and shows the viewer engagement with videos. The report will display:

Performance Report

Experience Stream

The Experience Stream report displays one row per action. The report includes views of bookmarks, user interactions with player controls, annotations and widgets. Progress events are excluded. The report will display:

Performance Report

Poll Widget Detail

The Poll Widget Detail report will display one row per poll submit event. The report will display:

Performance Report

Poll Widget Summary

The Poll Widget Summary report will display one row per Poll widget response value with a count of the responses. The Project ID column will contain a list of all projects where the poll appeared and was submitted. This is included to support templates where the same poll widget will appear with multiple projects. The Project IDs list is not de-duped. The report will display:

Performance Report

Project Summary

The Project Summary report displays aggregate performance data across all users for each project. Each row in the report is a separate project. The report will display:

Performance Report

User Summary

The User Summary report is an aggregate summary of the overall behavior of each user across each project that they viewed. The report will display:

Performance Report

User Activity Stream

The User Activity Stream report shows an event-by-event rundown of each action a viewer has taken in a project. For example, each time a bookmark is clicked, link is clicked, quiz responded to, video ended, all these events are tracked in this report. Progress events are excluded. The report will display:

Performance Report

User Sentiment Summary

The User Sentiment Summary report shows the results of the user summary widgets. The report will display:

Performance Report