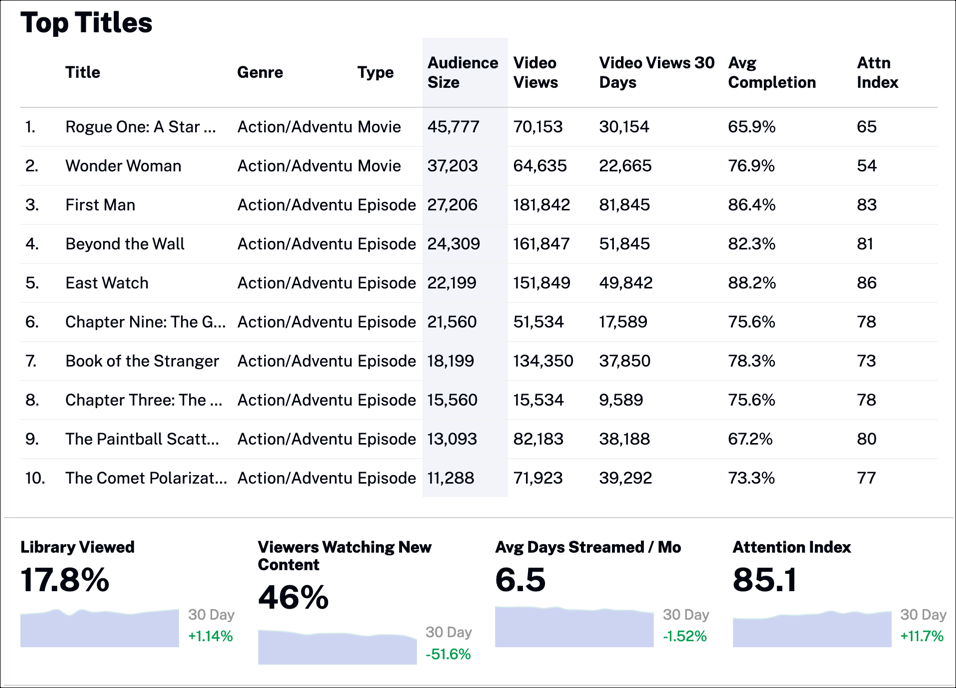
This table shows which titles in your content library are driving the most traffic.
Data
Table data:
Title - Title of the content viewed
Genre - Stylistic or thematic category for grouping video content
Type - Type of video content or group of content; values are Series, Season, Episode, Movie
Audience Size - Number of unique viewers
Video Views - Number of times a video started playing, recorded when the stream is started (does not include rewind or replay); it is not a measure of individual viewers
Video Views 30 Days - Number of video views for the past 30 days
Avg Completion - Average percentage of the amount of video content viewed by each user
Attn Index -
Graph data:
Library Viewed - Percentage of your video library viewed by all customers
Viewers Watching New Content - Percentage of viewers watching new video content
Avg Days Streamed / Mo - Average number of days streamed per user for the past 30 days