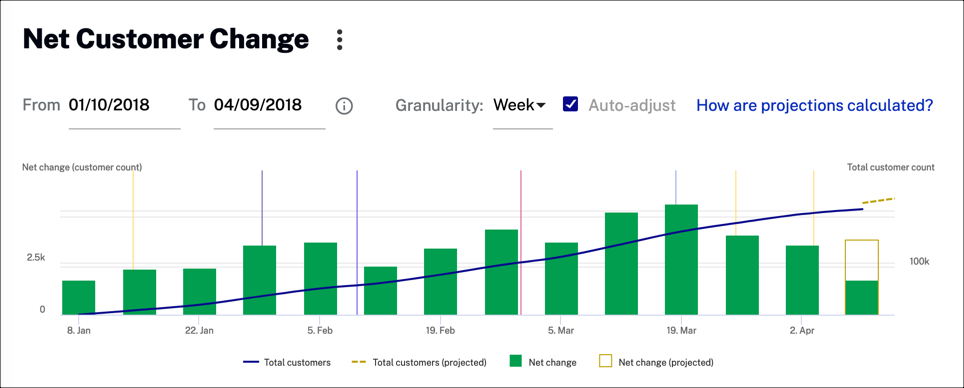
The graph below shows the total number of your customers and the net change over time.
You can select any of the following actions to change the data presented:
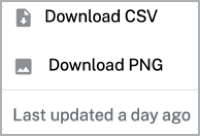
 to download customer change data as a CSV file or a PNG image.

 to automatically change the x-axis dimension.
The following data is displayed in the graph: