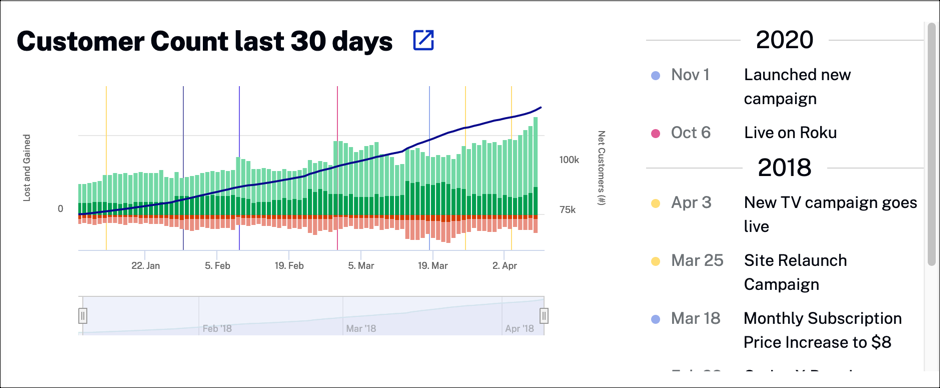
The following graph shows your customer count for the last 30 days. Milestones are listed and presented in the graph using vertical, colored lines.
You can select any of the following actions to change the data presented:
 to open a new window with the ability to view data by these options:
 to download customer change data as a CSV file or a PNG image.