The Content Trends section of Insights provides several different ways to see trends in your content library, detailed below.
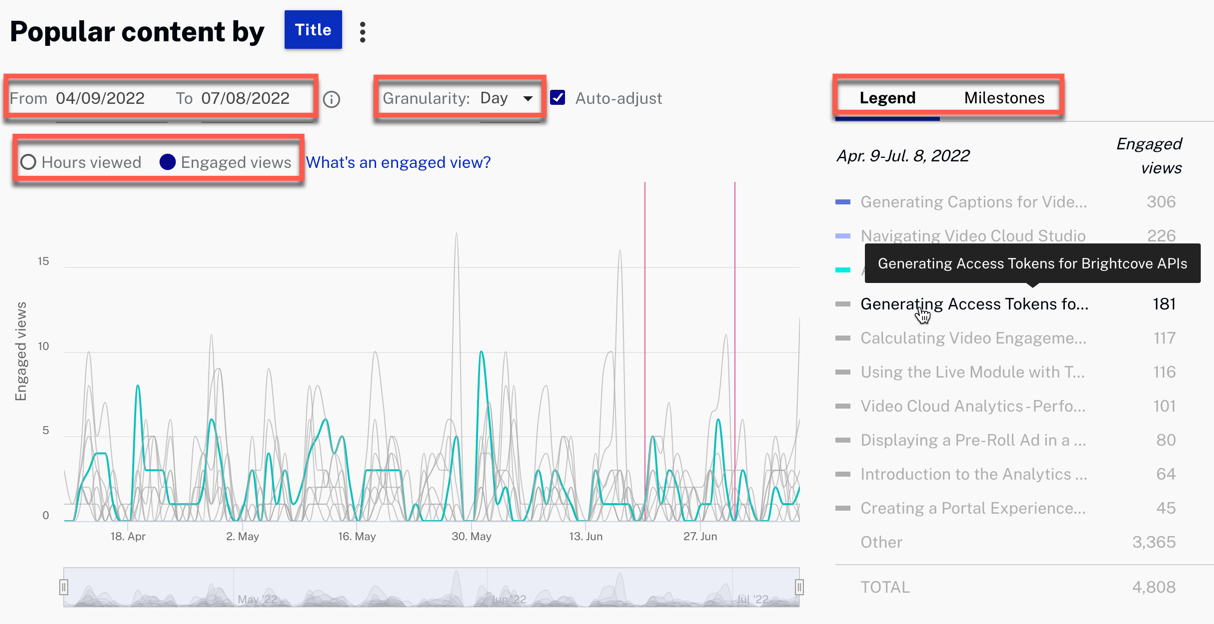
In the Popular Content graph, you can see a ranking of your titles by hours viewed or the number of engaged views (at least 30 seconds). Note that you can mouseover a title in the Legend to highlight its line in the graph, and also adjust the date range and granularity:
Below the Content Trends graph are some data points for you overall content library:
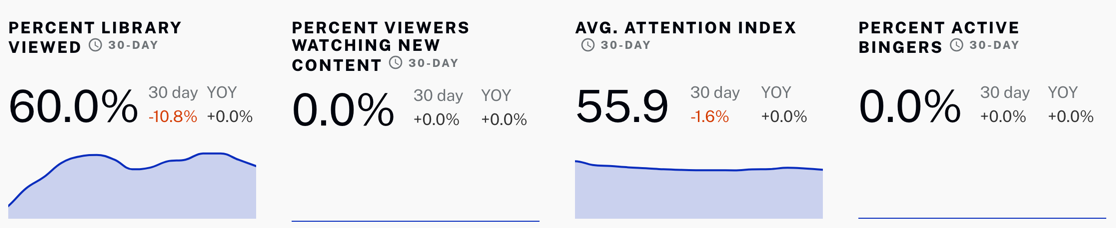
Note that you can drag the mouse over these to see data for each day.
The relevance of these will likely vary somewhat depending on the kind of content you have, but Attention Index is one probably everyone will find useful. It ranges from -100 to 100, comparing the number of "dissatisfied viewers" (who watched at least one minute but less than 10% of a video) with "satisfied viewers" (who watched at least 75%). Negative numbers mean you have more unsatisfied than satisfied viewers.
You can see details about audience size, engaged views, completion rate, and so forth for all your content in this section of Insights:
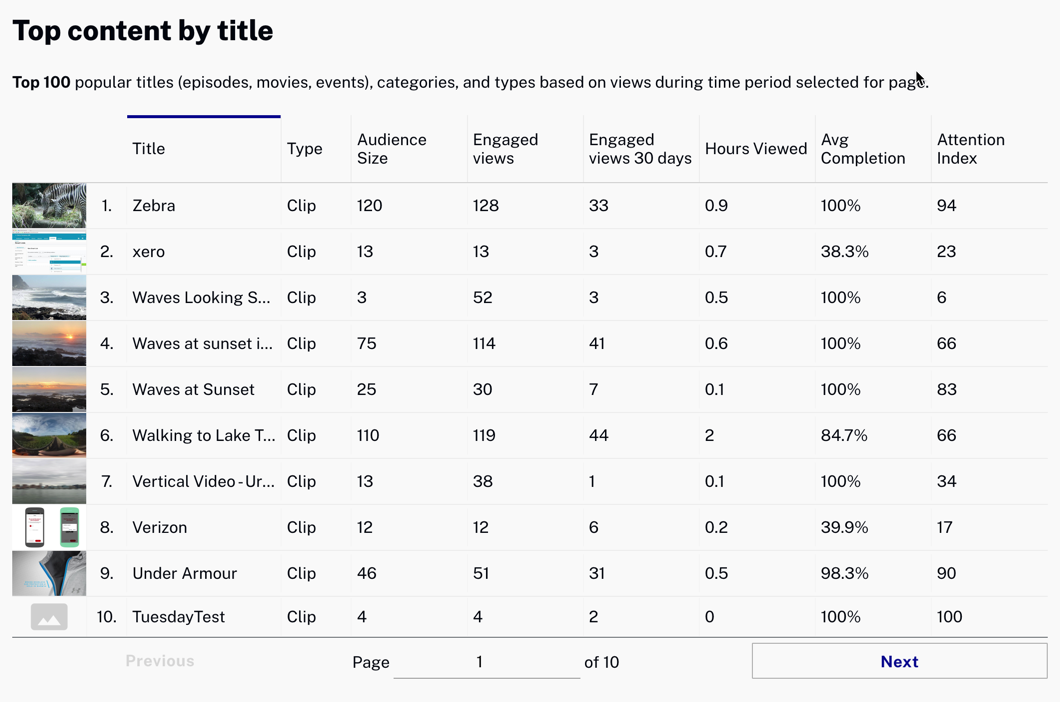
Click on any column to sort the content list by that column.
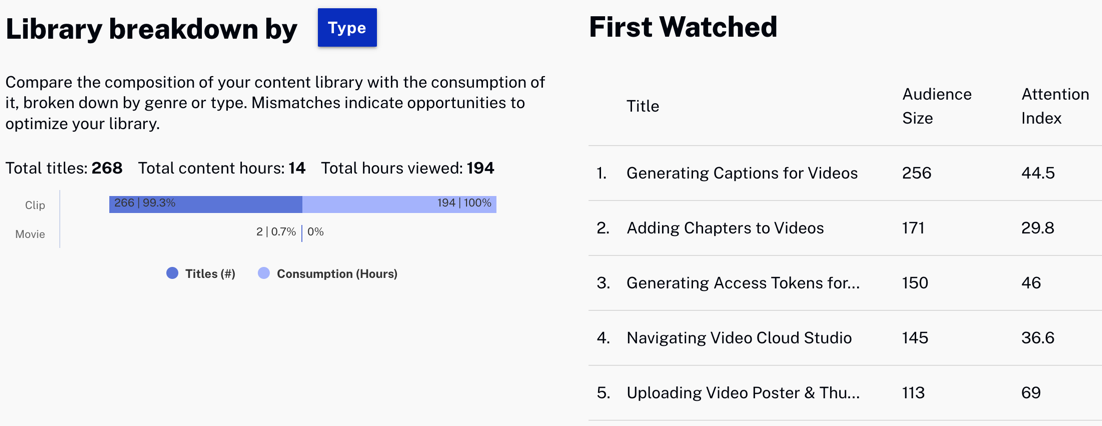
The last two parts of Insights offer you information on the performance by type (short clips vs. full videos) and on videos watched for the first time in this period: