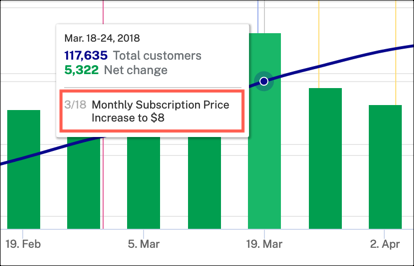
See how your customer count changes over time. This graph includes projections and trends and milestones.
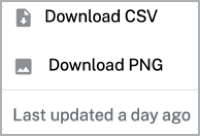
You can select any of the following actions to change the data presented:
 to download customer change data as a CSV file or a PNG image.


 to automatically change the x-axis dimension.
The following data is displayed in the graph:
See the four week running average number of customers as well as the future trends for customer count.
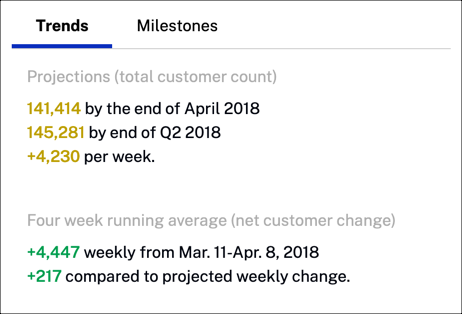
The following data is displayed above:
Create a milestone to track how it effects your customer count.
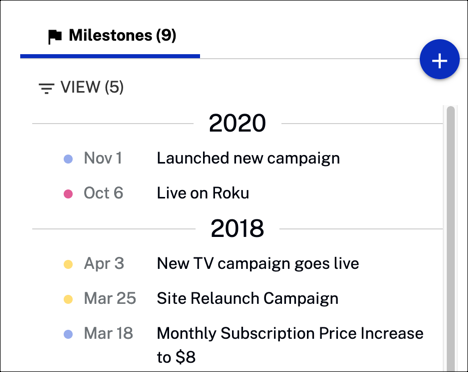
You can select any of the following actions:
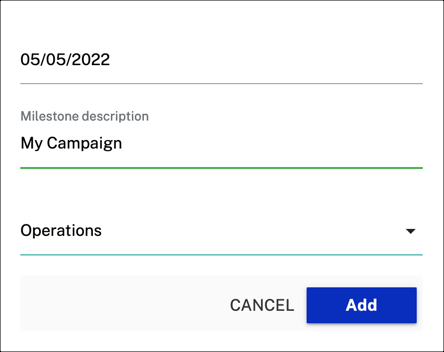
>Click  to create a new milestone. Fill in the form fields and select ADD when complete.
Hover over the graph to see the data and associated milestone.