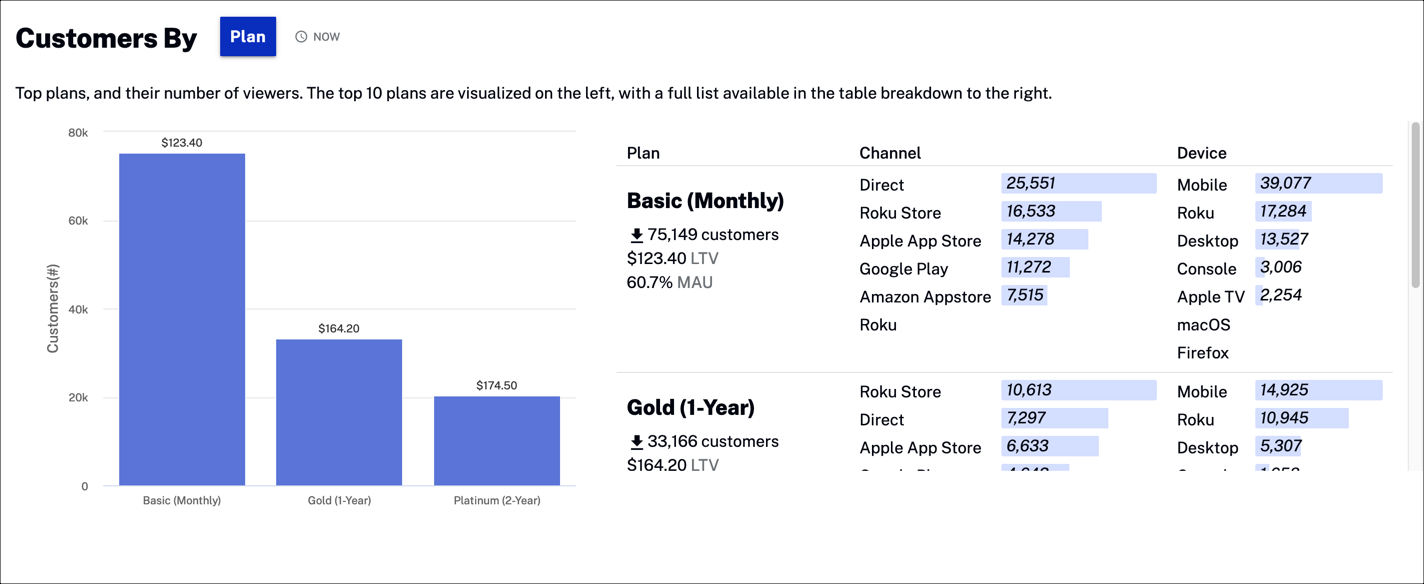
Display the top number of viewers by category. The top 10 are displayed in the graph, with a detailed list to the right of the graph.
Actions
You can select any of the following actions to change the data presented:
Click to select the category for the data displayed.
Hover over to see the following note:
This insight is a current snapshot of your business.
Data
The following data is displayed in the graph:
Customers(#) - The y-axis show the number of customers for each category; each bar in the graph also shows the revenue from those customers
Basic (Monthly) - The x-axis shows the types of data for the category chosen; in this case, it is by plan
Plan - The subscription plan with the rise or drop in number of customers
LTV - Lifetime value (LTV) estimates the amount of revenue a customer represents to a business over the life of the relationship; this is helpful for determining the cost efficiency of acquiring new customers and supporting them over time
MAU - Monthly Active Users (MAU); active users are defined as being signed in
Channel - The app store from where users viewed your channel
Device - The device from which users viewed your content
 to select the category for the data displayed.
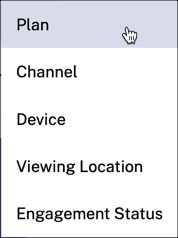
 to see the following note: