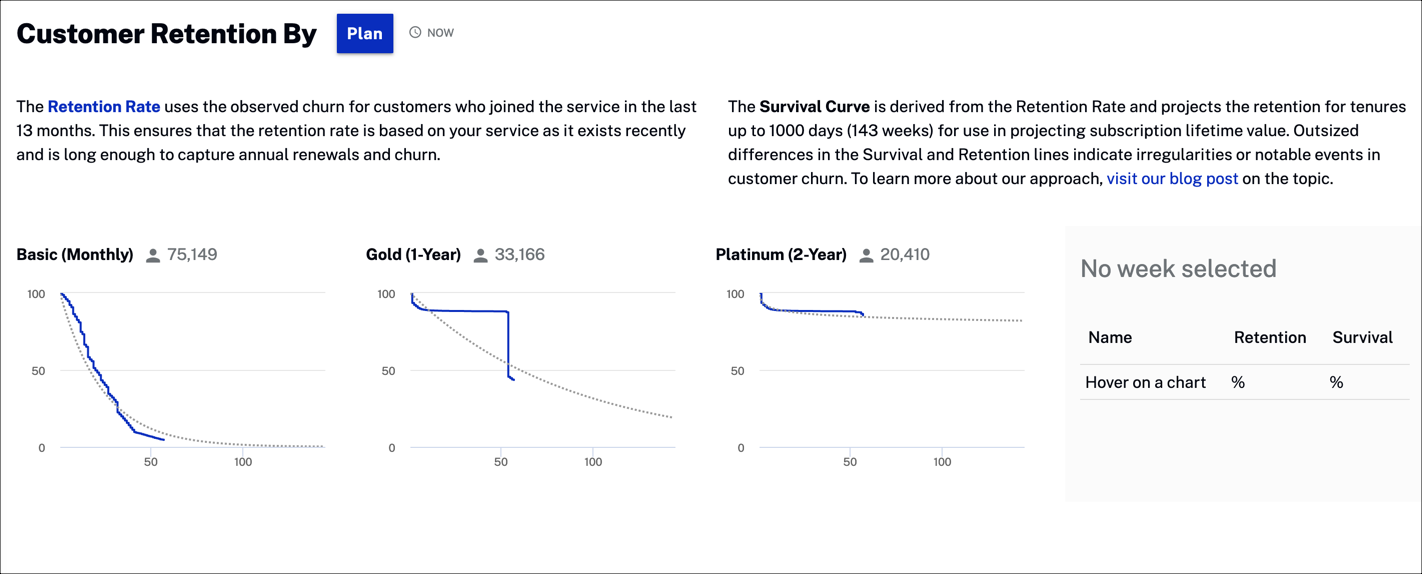
View customer retention rate and projected survival rate over time.
Actions
You can select any of the following actions to change the data presented:
Click to select the category for the data displayed.
Hover over to see the following note:
This insight is a current snapshot of your business.
Data
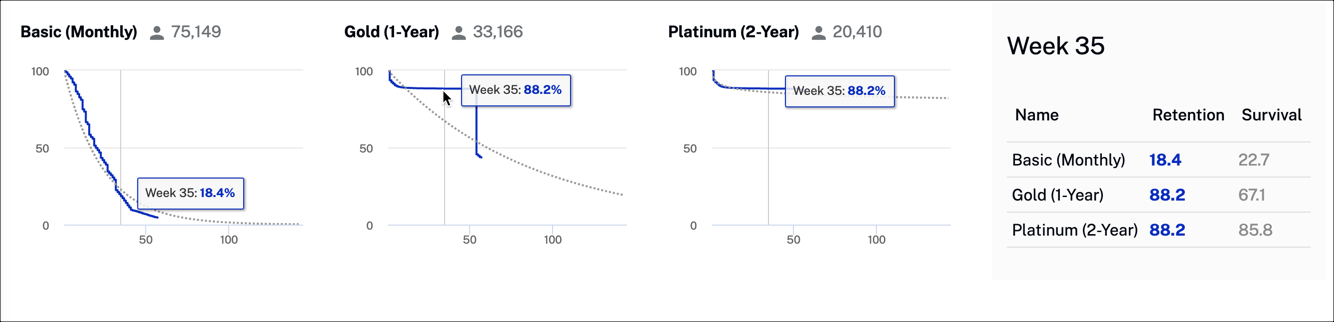
Hover over any graph to display retention and survival rates in the chart to the right.
Retention - Retention Rate uses observed churn for customers who joined the service in the last 13 months; this ensures that the retention rate is based on your service as it exists recently and is long enough to capture annual renewals and churn
Survival - Survival Curve is derived from the Retention Rate and projects the retention for tenures up to 1000 days (143 weeks) for use in projecting subscription lifetime value; outsized differences in the Survival and Retention lines indicate irregularities or notable events in customer churn
 to select the category for the data displayed.
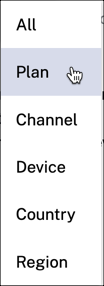
 to see the following note: