Analytics data is sent automatically by the Brightcove Players, including those provided by the Native Player SDKs. If you are not using a Brightcove Player to deliver {{ site.product_short }} videos, you need to instrument the player you are using to send the data to the Data Collector. See the Overview: Data Collection API topic for more details.
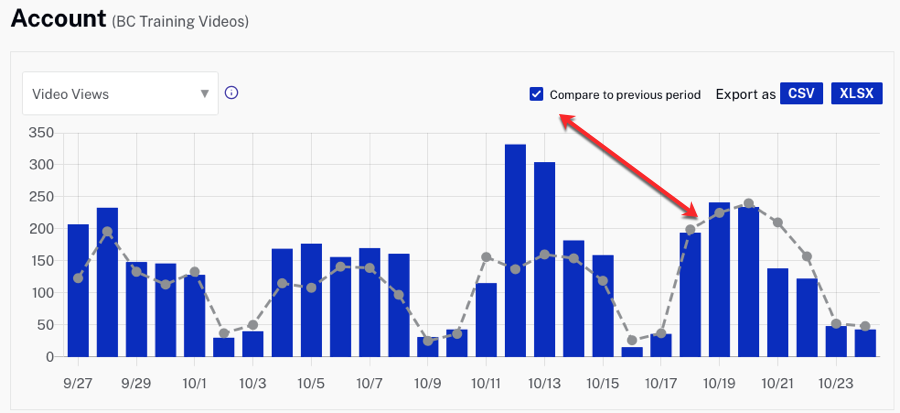
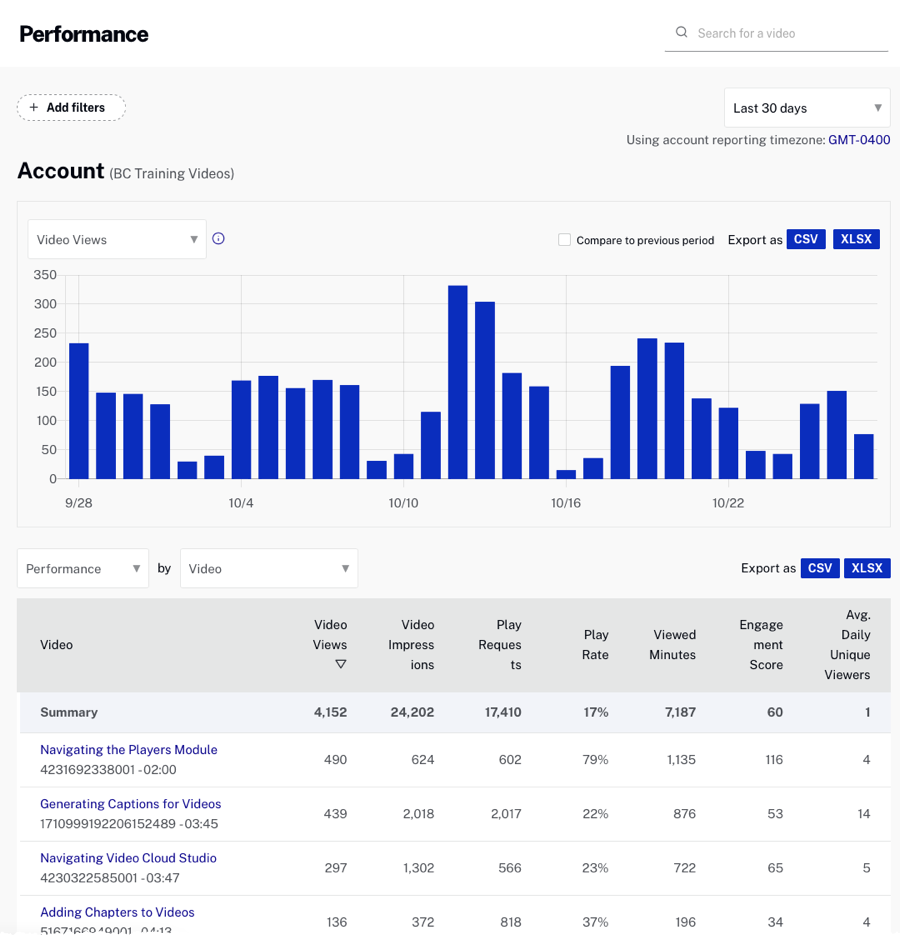
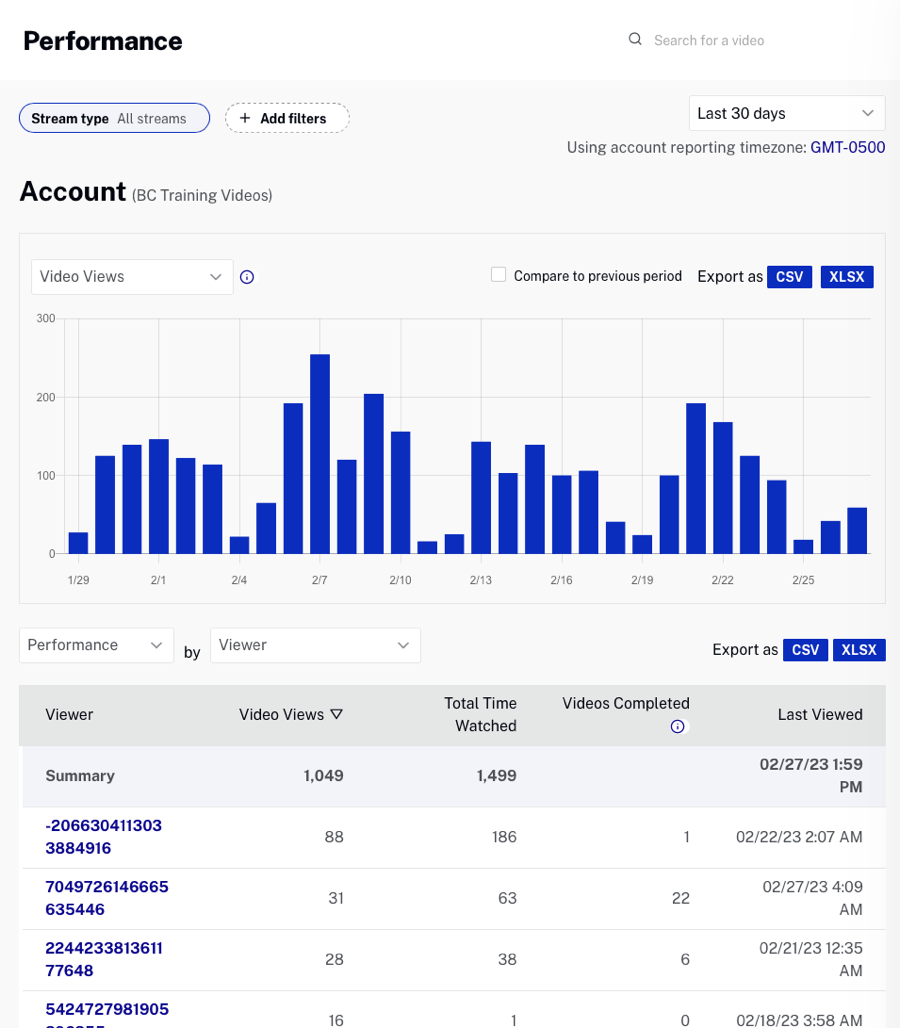
To view the Performance report, open the Analytics module and select Performance from the left side navigation. The report will display a graph showing total video views per day for the time period selected. The dropdown list can be used to select another metric:
- Video Views - The number of times a video started playing, recorded when the stream is started (does not include rewind or replay); it is not a measure of individual viewers; for videos with pre-roll ads, a view is not recorded until the video starts to play
- Video Impressions - Number of times a video was loaded and ready for interaction
-
Play Requests - The number of times playback was requested - play requests are generated by:
- the viewer initially clicking the play button
- the viewer pausing the video and clicking play to resume playback
- an autoplay event
- the viewer scrubbing or clicking on the playback timeline (which pauses and restarts the video automatically)
- Play Rate - The percentage of videos that were loaded that were actually played (video views / video impressions)
- Viewed Minutes - Number of minutes the video was watched
- Engagement Score - The average percent watched per video view (calculated by adding all the percentage watched divided by the number of video views)
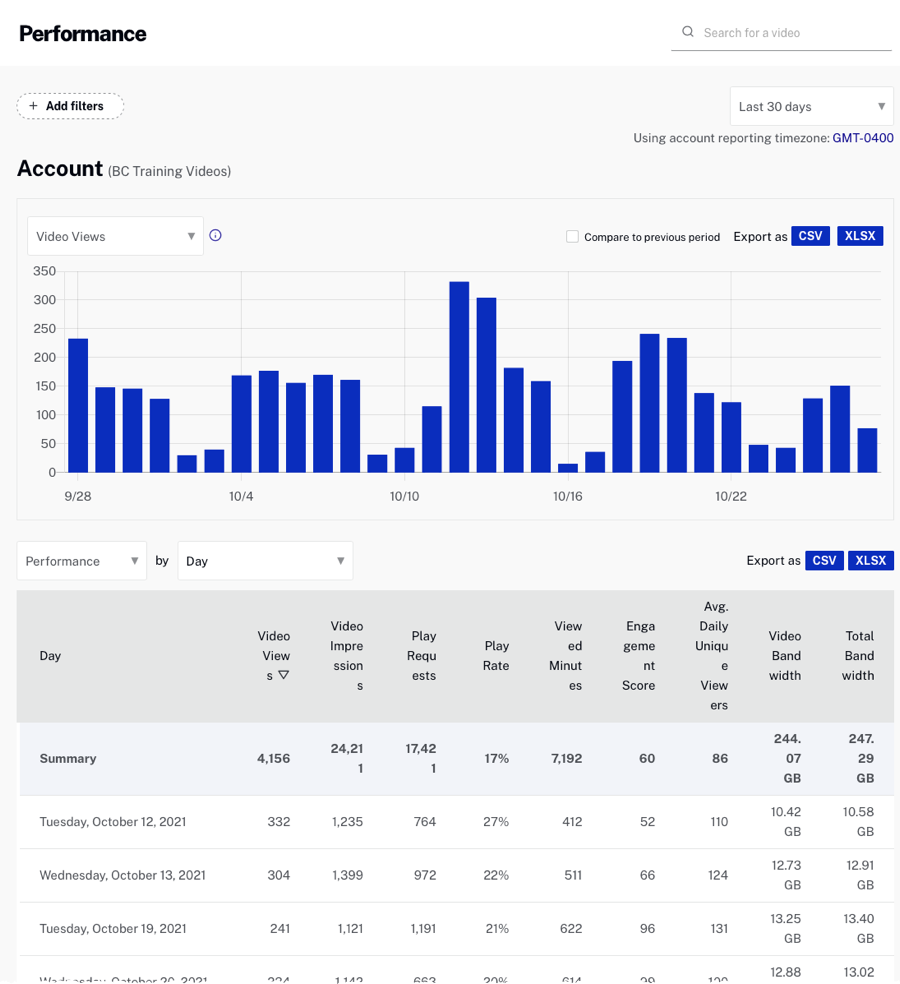
- Daily Unique Viewers - Calculated using the IP address and user agent of viewers. Brightcove made the decision not to use a 3rd party cookie because cookies are increasingly being blocked by browsers. Daily Unique Viewers is available at the account or video level; this metric is not available when filtering by a video (or anything else). Brightcove also provides the ability to base unique viewers on the value you provide instead of their IP address. For more information, see the Analytics Event Tracking developer document.
- Video Bandwidth - Includes bandwidth for the content delivered including video, images, text and audio tracks. Note that bandwidth data is delayed by 3-5 days.
- Total Bandwidth - Includes Video Bandwidth and the bandwidth generated by player loads. Note that bandwidth data is delayed by 3-5 days.
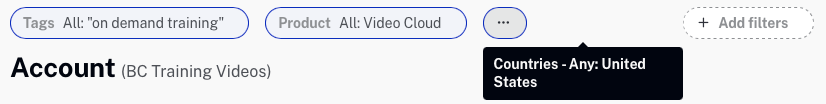
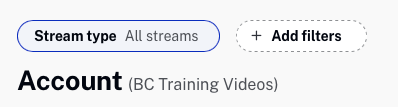
By default, the report will display performance data for all stream types. If your account is enabled for Brightcove Live, you can choose to view performance data for all videos, VOD assets or live assets. Click the Stream type pill to make a selection.
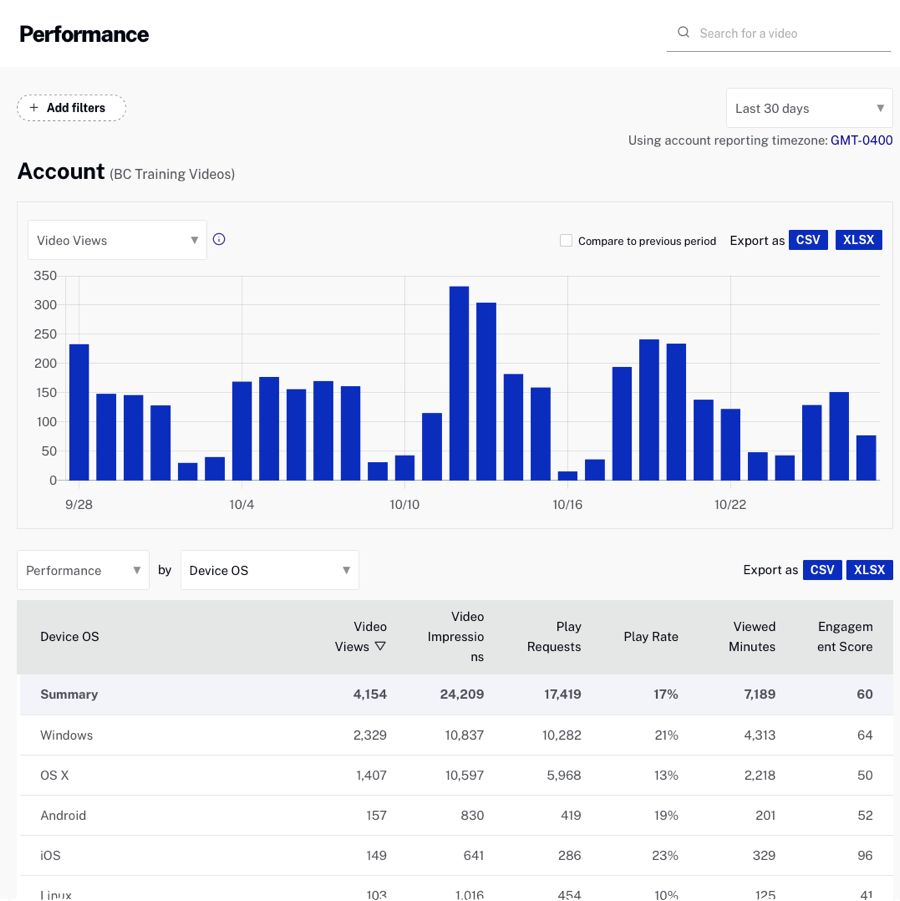
The report switcher below the chart can be used to quickly switch to another report.
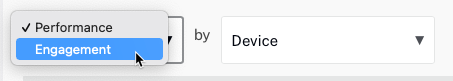
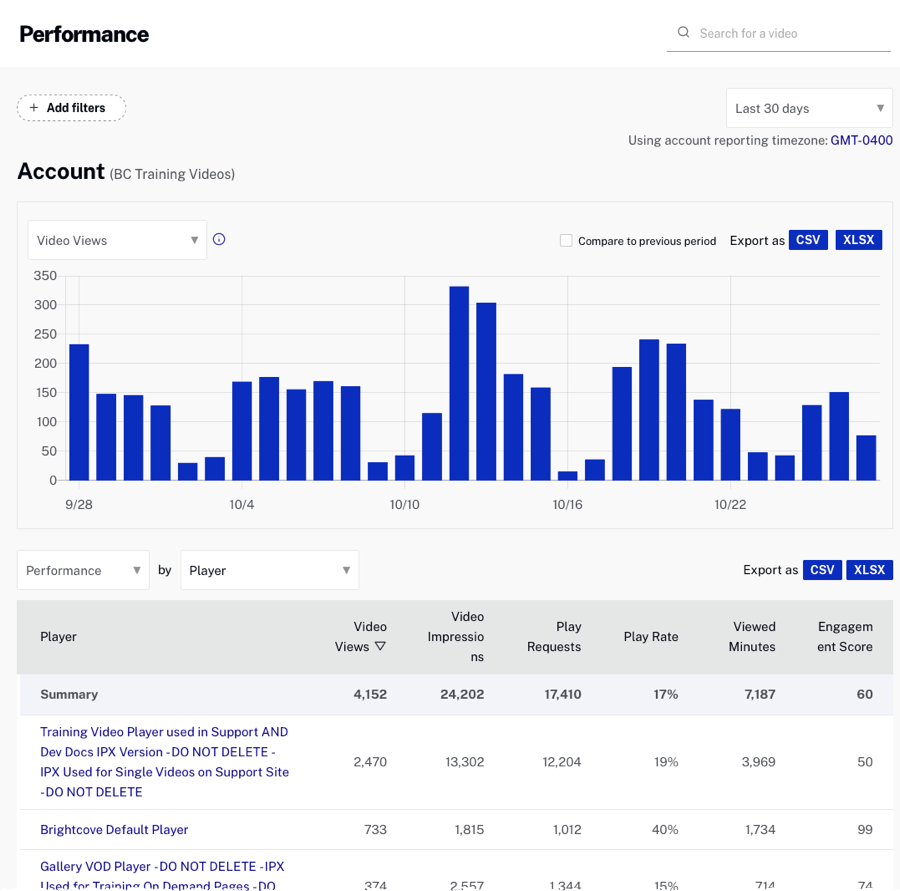
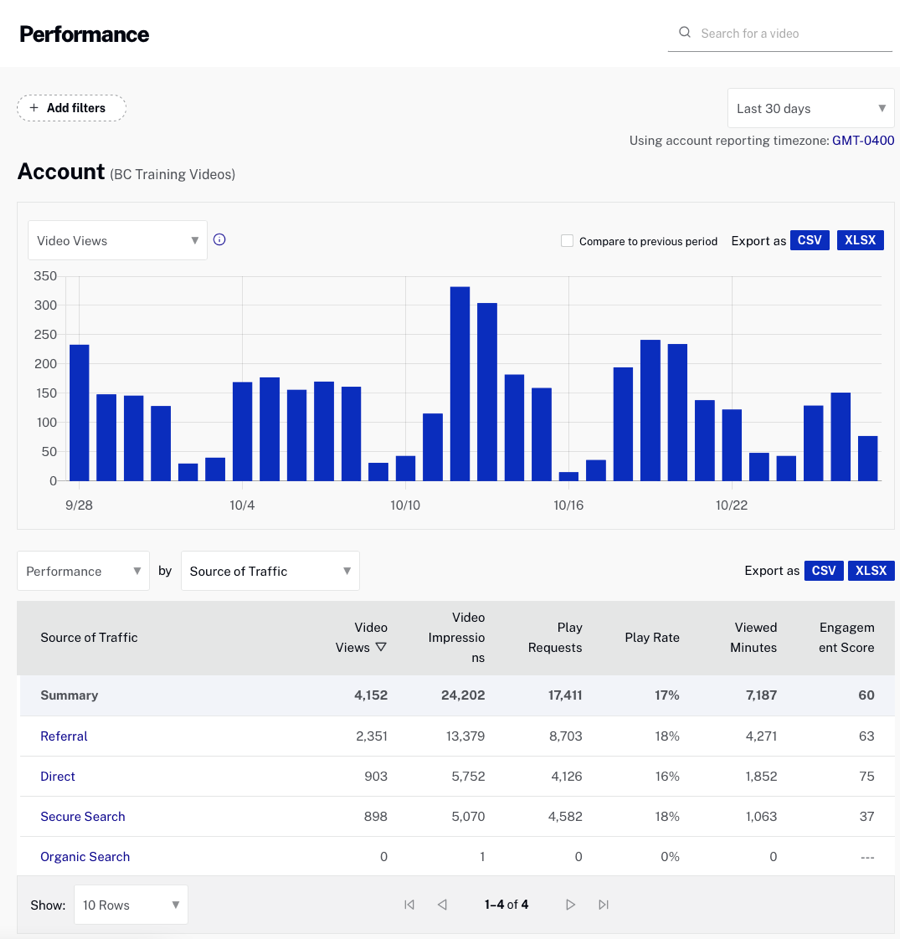
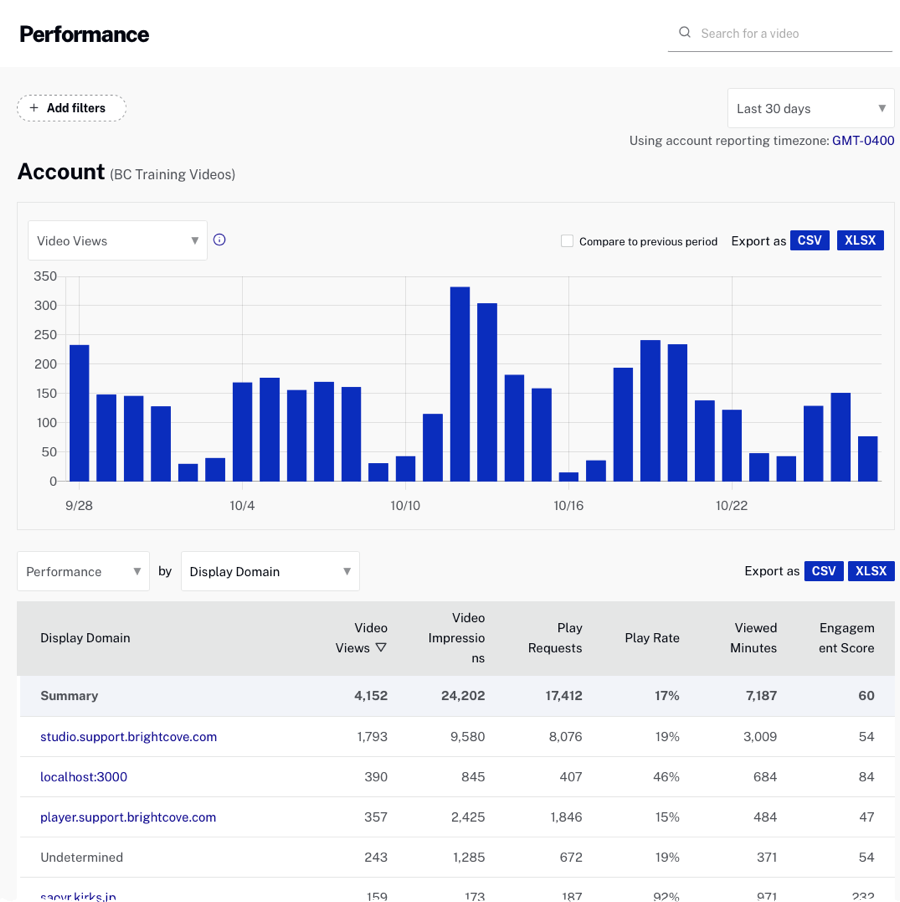
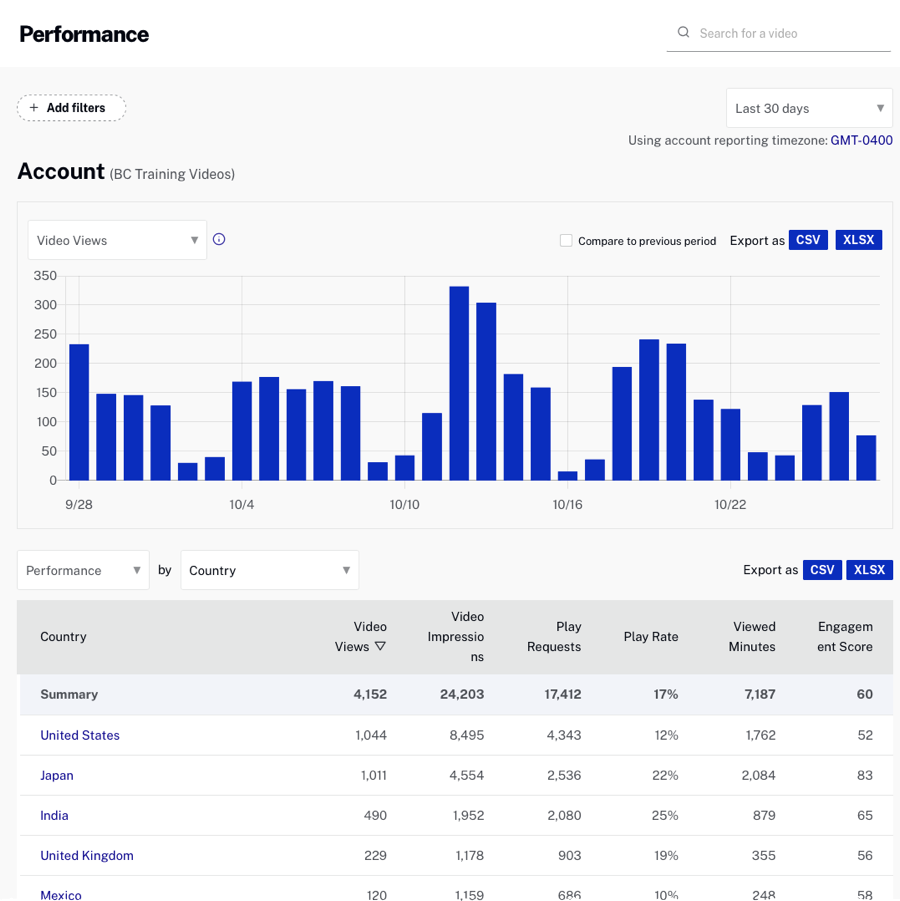
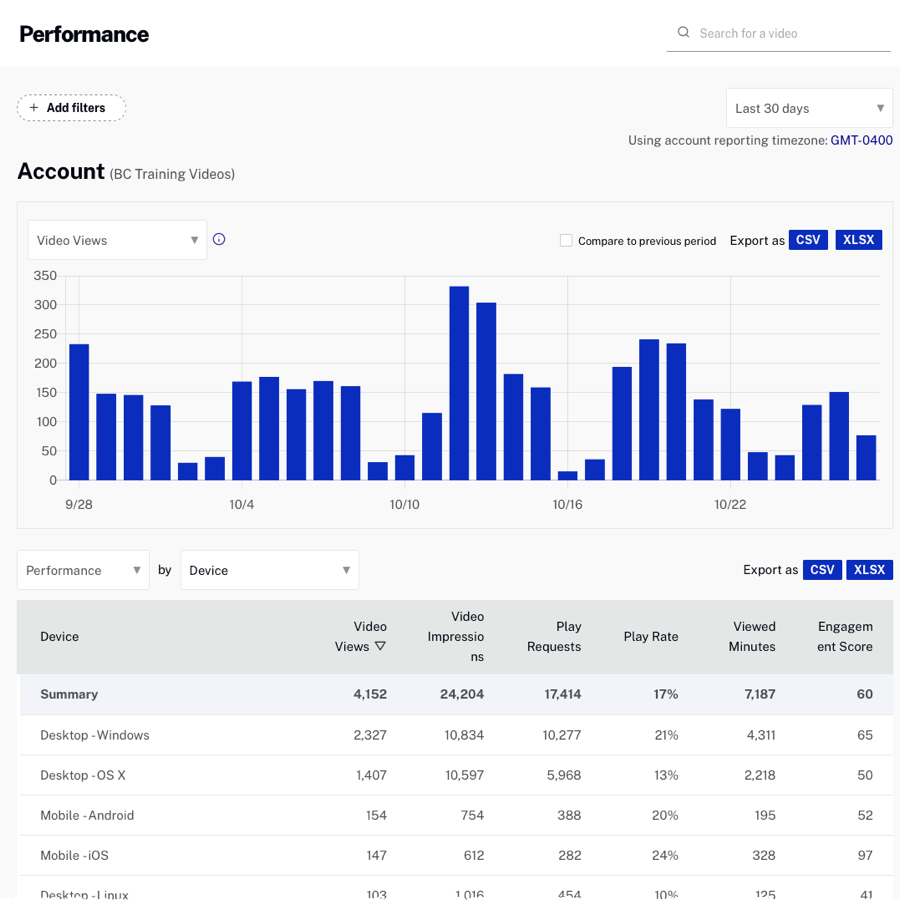
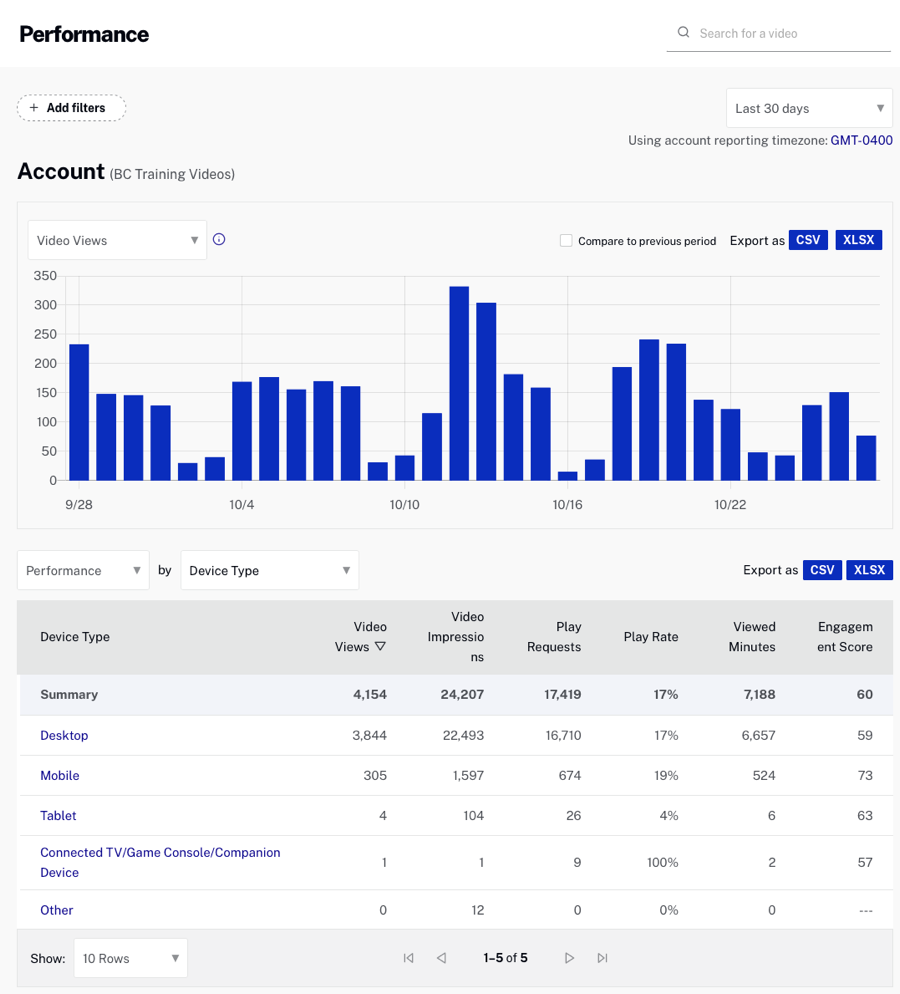
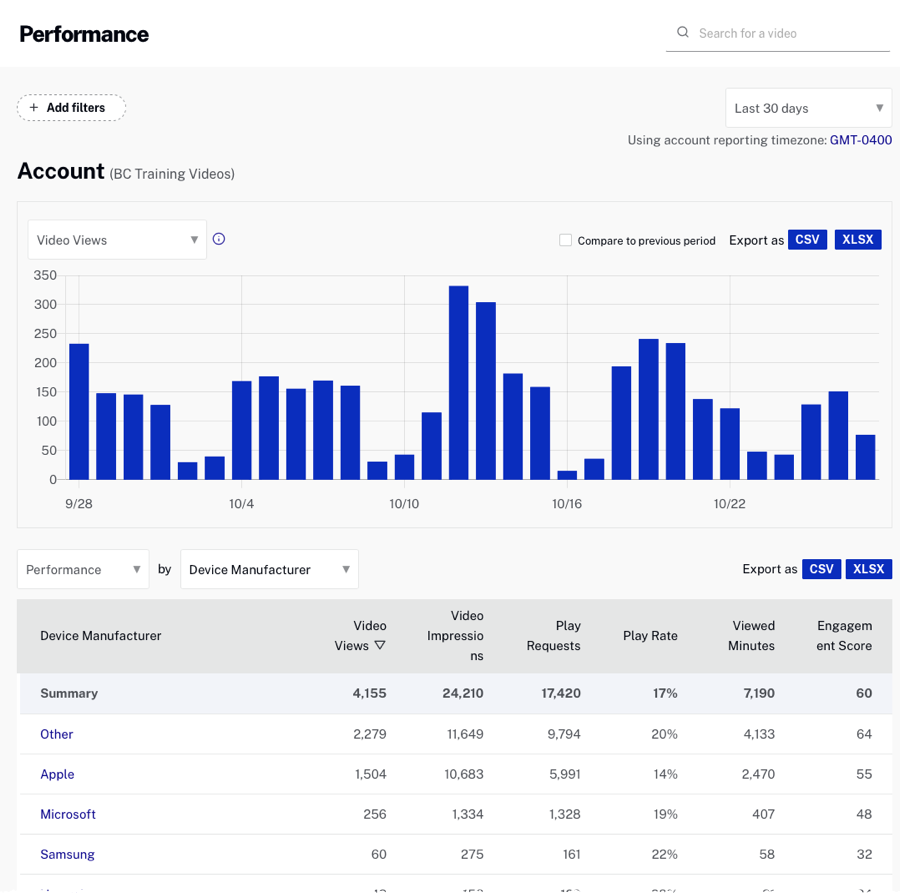
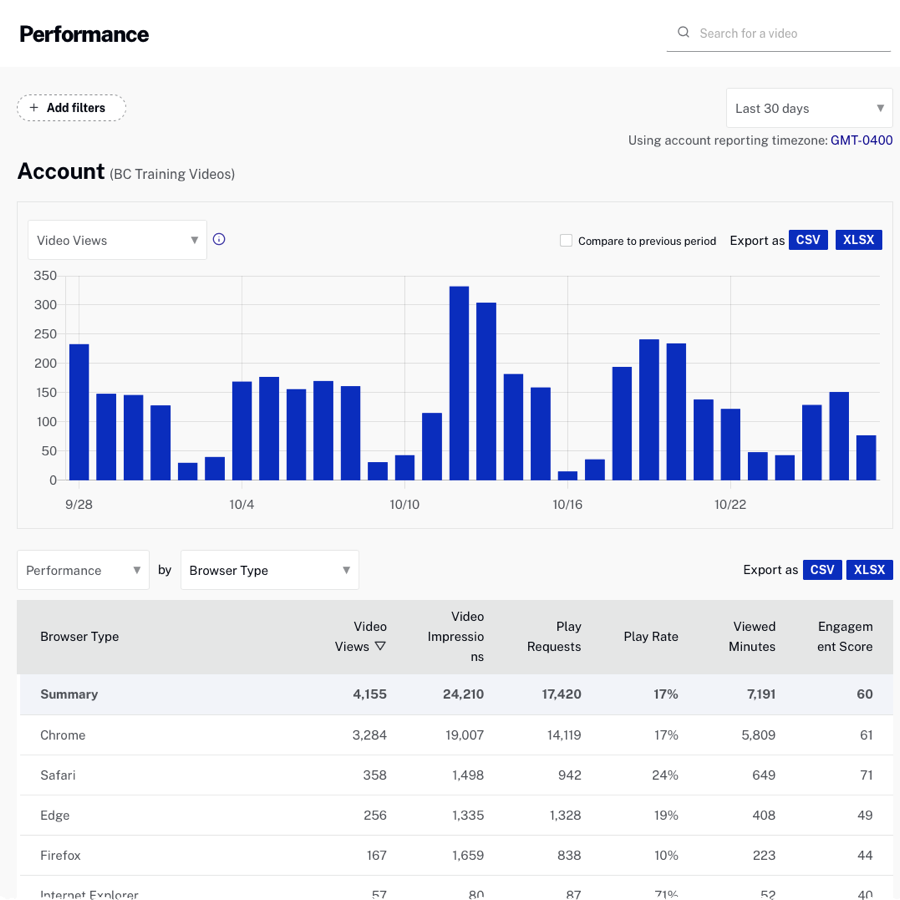
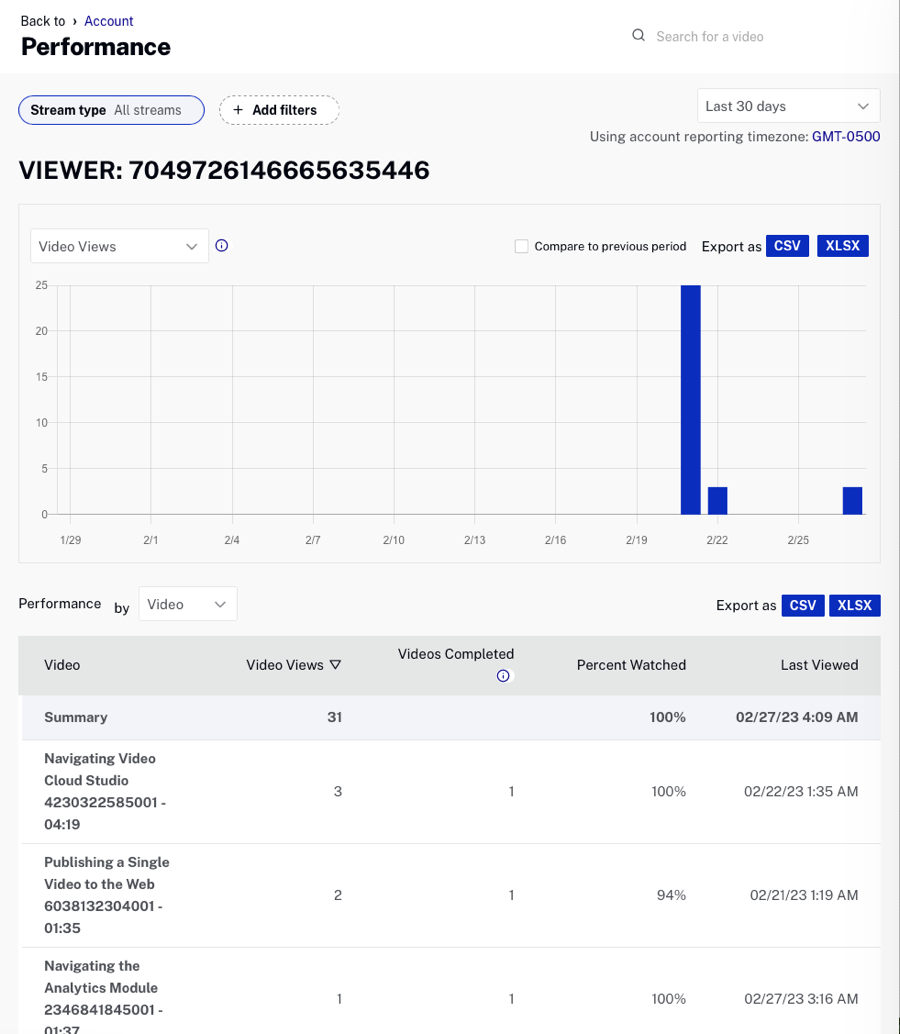
The dropdown list to the right of the report switcher can be used to select a report dimension. The bottom of the report has controls which let you select how many rows should be displayed and for navigating to other pages.
The following dimensions are available with the Performance Report:[1-1]
- Video
- Player
- Source of Traffic
- Display Domain
- Country
- Device
- Device Type
- Device OS
- Device Manufacturer
- Browser Type
- Day
- Viewer[1-2]
Notes:
- [1-1] The available dimensions will change based upon the report that is selected.
- [1-2] If the Viewer dimension has been enabled for the account. Also note that for the dimension Viewer, Today is not supported as a date range.