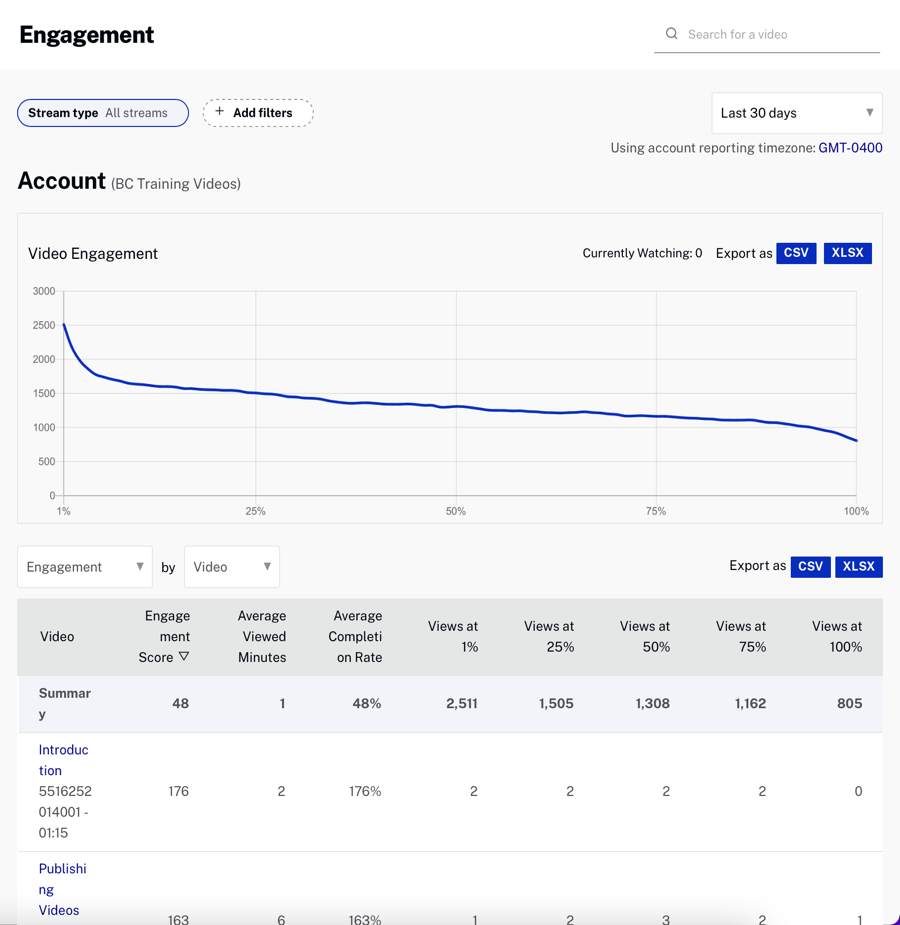
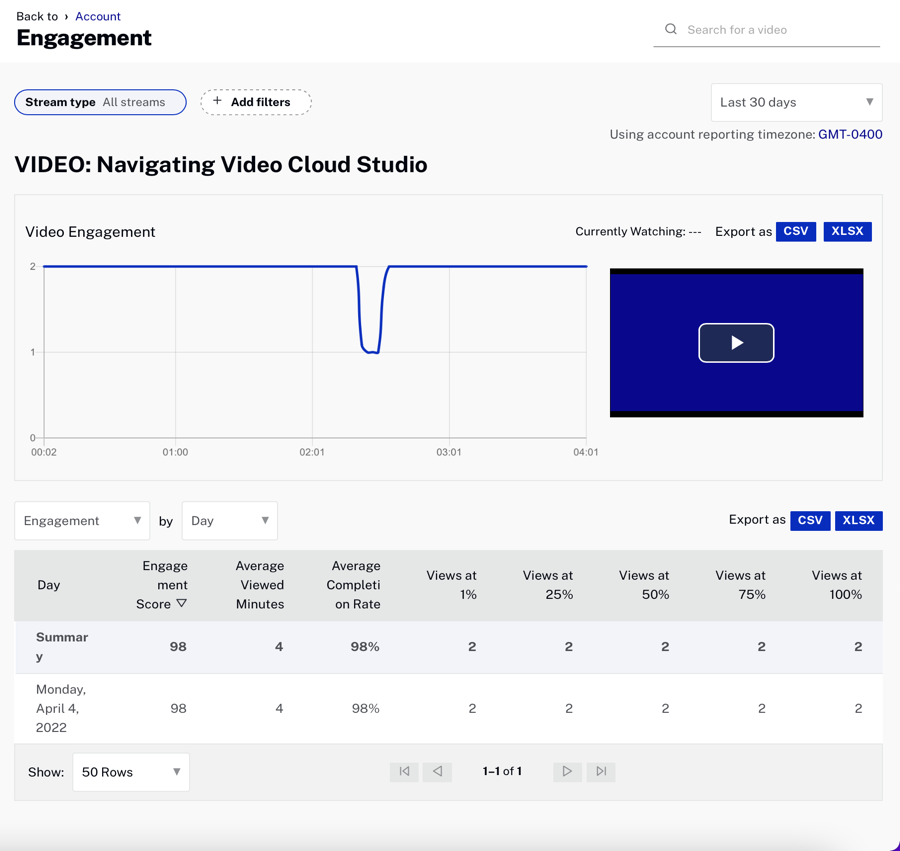
To view the Engagement report, open the Analytics module and click Engagement in the left side navigation. The report will display a graph showing total video engagement for the time period selected. The report switcher below the chart can be used to quickly switch to another report.
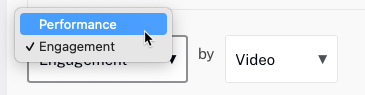
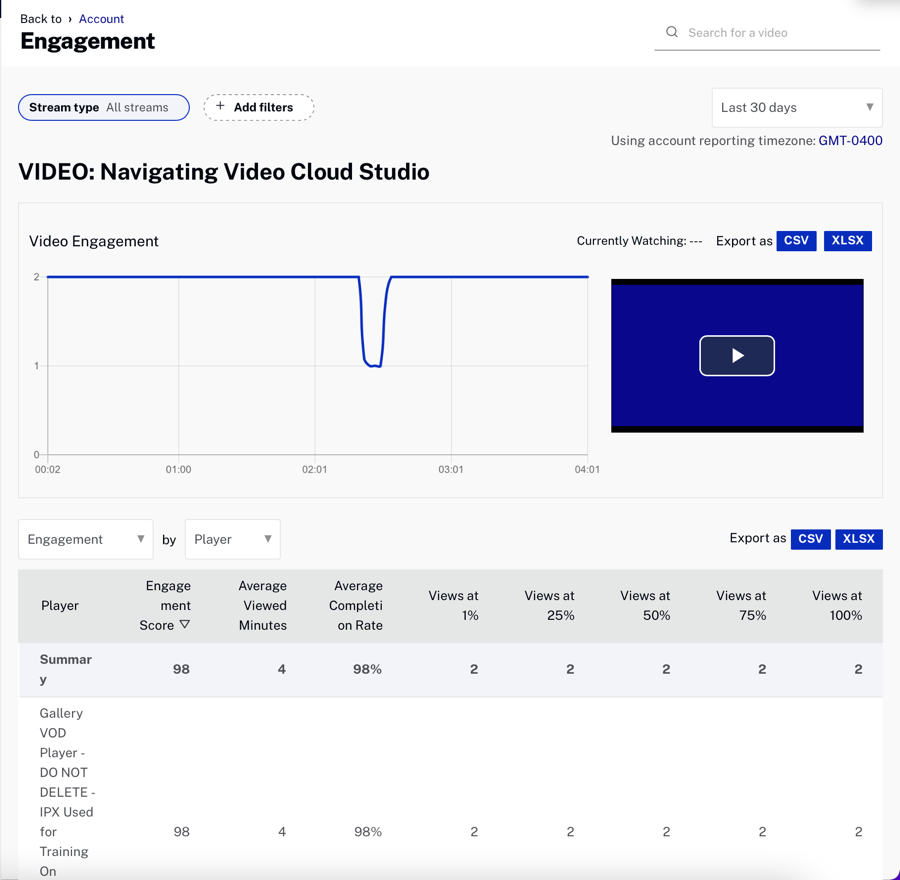
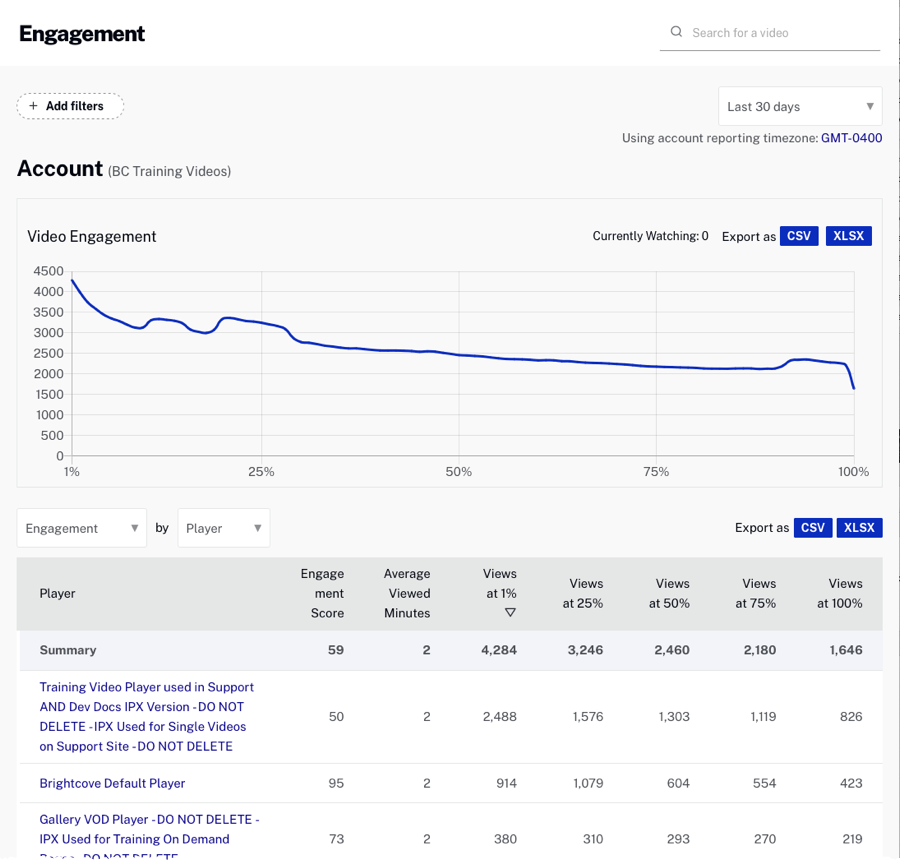
The dropdown list to the right of the report switcher can be used to select a report dimension. The following dimensions are available with the Engagement Report:
The body of the page will display a list of videos sorted by engagement score. The bottom of the report has controls which let you select how many rows should be displayed and for navigating to other pages.
The video_engagement
event is a means of tracking video engagement while a video is playing back, and will likely be sent many times during playback. (The player instrumentation sends this event every 10 seconds, if playback is not interrupted.) At present, events describing ranges over 20 seconds are discarded by the Analytics system, so it is necessary to send these events more frequently.
Engagement is a measure of views, not viewers. In reporting the engagement data, we divide the video into 100 equal parts and count the views in each 100th. There is no distinction between one viewer watching a 100th part 5 times, and five viewers watching it 1 time.
Also, engagement is a measure of views at particular points in a video, not video views. Repeated views at a particular point by scrubbing back and watching again will increase engagement at that point but not video views.
The measurements are rounded in the Analytics UI for presentation. The numbers are a result of counting views by individuals and then normalizing those counts along a percentage of a video's timeline. The export API returns the result of this count. Since these are counted values, there is no simple way to estimate the significance of the value to a specific number of digits.
Note that engagement statistics for live streams are not reliable, because the duration of the video is not fixed.
It is possible for the engagement score to be greater than 100. Scrubbing and re-watching a video doesn't trigger new video_view events, but it does track video_engagement. For example, say we have a video in a single video player on a page somewhere. The following events show how the video engagement could vary widely:
For more details on how we calculate video engagement, watch the training video Calculating Video Engagement.
For 32 days, Brightcove keeps detailed analytics data for videos (views for each one-hundredth of the video duration). After that time, the analytics data is moved to historical data, and only views at the 1%, 25%, 50%, 75%, and 100% points are kept.
Exported reports from the Analytics module will include only views at the 1%, 25%, 50%, 75%, and 100% points, even for periods within the past 32 days. For more detailed engagement data within the past 32 days, the Analytics API must be used.
The first column that appears in the body of the report will vary based upon the report dimension that is selected (video, player, or day). All reports will display the following data:
In all cases, views at x% means that this segment of the video was played back in the player.
Note that the Views at x% is not the same as a Video View in the Performance Report. A video view is counted when a video first starts playing back. The views at 1% is recorded when the first percent is watched. The difference here is that if the first percent is watched multiple times (if the video is set to auto-replay, for instance), the count increases, whereas a video view is counted when the video first starts playing back but is not counted on a replay (unless the user reloads the page or watches another video in the playlist, etc).
When the Video dimension is selected, a graph will display the overall video engagement for the time period selected. The body of the report lists the video name, video ID, duration and the engagement details for each video.
Clicking the link for any of the videos will display the video engagement for that video.
The preview player is synchronized with the engagement graph and provides to ability to see in the video where any engagement spikes or drop-offs occur. By clicking on any point in the engagement graph, the player will play the corresponding point in the video.
When the Player dimension is selected, a graph will display the overall video engagement for the time period selected. The body of the report lists the engagement details for each player.
Clicking the link for any of the players will display the video engagement for that player.
When the Day dimension is selected, a graph will display the video engagement for the time period selected. The body of the report lists the engagement details for each day. In the body of the report, you can use the drop down list to view the video engagement by Video or Player.
Filters can be used to limit the data that appears in the report. To add a filter, follow these steps.
The applied filters will appear in pills at the top of the report. Each pill will display a filter type and up to two values. Up to three pills will be displayed.
Additional pills are collapsed into an overflow pill and, are displayed in a tooltip on hover.
To remove a filter, click a pill and clear the filter from the filter panel.
Report data can be downloaded as both comma separated values and Excel formats. Note that the export feature saves the data directly from an Analytics API call. The exported data is not manipulated the way the UI data is, and currently contains all of the underlying data in the report, not just the subset of fields the UI shows. Some of the differences between what is shown in the UI vs. the exported data:
Having all of the data in the original format from the API allows you to manipulation the data in ways other than what is provided in the UI.
The export buttons above the graph will export the graph data. Note that the reports support print-friendly style sheets so printing a report or saving to PDF will generate a printer-friendly page.