To create a custom report, you will perform the following steps:
{% if site.product_short == "Video Cloud" %}The Analytics module can be used to generate custom, ad-hoc analytics reports that can be downloaded in comma separated values (.csv) or Microsoft Excel (.xlsx) formats. Reports can also be scheduled to run on a daily, weekly or monthly basis.
The Analytics API is used to retrieve data from the analytics system. The Analytics API can also be used to create your own custom reports. For more information on the Analytics API, see the Analytics API documentation.
To begin creating custom reports, open the Analytics module and click on the Custom link in the left navigation.
Reporting time zone
Data in custom reports is shown using the account's reporting time zone offset. The reporting time zone can be configured from the {{ site.product_short }} Studio home page by going to Admin > Account Settings > Default Reporting Time Zone. Note that only account administrators have access to the Account Settings.
The reporting time zone is used to calculate day boundaries for reporting data. Changing the reporting time zone setting only affects data going forward, and changes are not applied retroactively. If you change this setting, you may see a flat spot or a spike in your data when looking at day boundaries where the change was applied. Updates to this setting may not take effect immediately, and analytics data may continue to refer to the old setting until the system processes the changes.
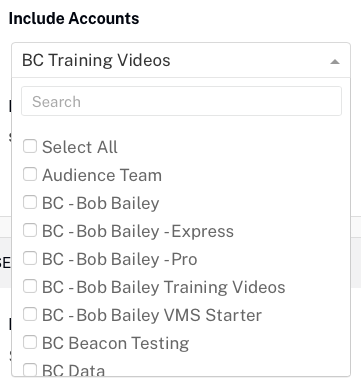
Selecting accounts
If you have access to multiple Brightcove accounts, you can include data from the current account or select multiple accounts.
If you create a report that includes all accounts and those accounts use different time zones, data is reported using the time zone for that account.
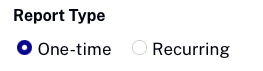
Selecting a report type
Select the type of report:
- One-time - The report will be run once, immediately
- Recurring - The report can be scheduled to run on a daily, weekly or monthly basis
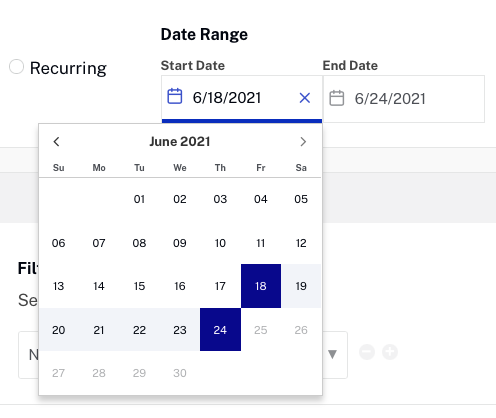
One-time report
Selecting One-time will run the report one time. A calendar control will appear and you can specify the time period that you want the analytics data to cover.
Recurring report
Selecting Recurring will run the report on a recurring basis. Select a report Frequency:
- Daily - Report covers an entire day
- Weekly - Report covers an entire week, with a week being defined as Monday through Sunday
- Monthly - Reports covers an entire month
- Enterprise accounts are limited to 20 recurring reports, Professional accounts are limited to 5
- Recurring reports are associated with a user and are available across all accounts the user has access to
- Recurring reports are executed after the analytics reconciliation has taken place, usually 3 to 5 days after the end of a reporting period
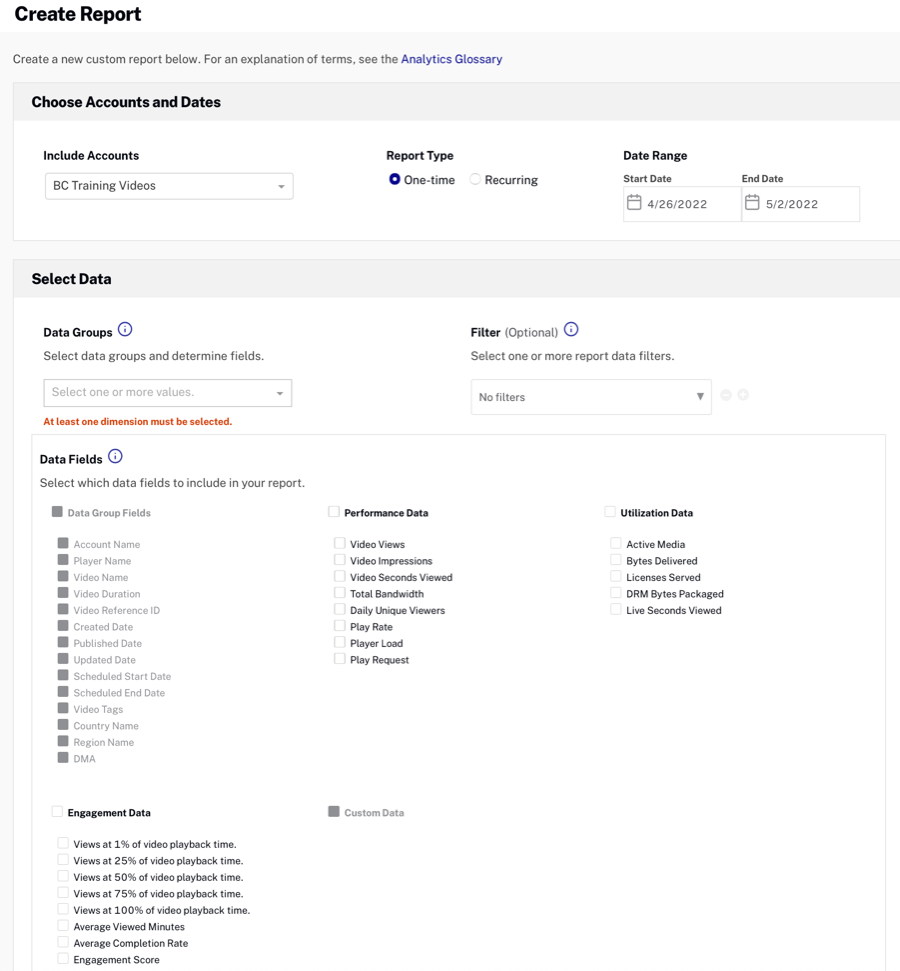
Selecting data groups
Data Groups determine the data fields that can be included in the report. The data fields that appear in the Data Fields section are based upon the data groups that are selected. You can select multiple data groups but some combinations are not valid. As data groups are selected, the list of available data groups will be updated to include only the valid groups that can be selected.
Data groups and fields
When you select a Data Group, the Data Fields that can be returned can be selected. Fields that are grayed-out cannot be returned for that Data Group.
To add a data group, click the  button. To remove a group, click
  .
.
Adding a report filter
Filters can be added to limit the amount of data returned. When using multiple filters, an AND operation will be used. In the following example, videos that are tagged video cloud essentials AND have the custom field Product=Video Cloud will be returned.
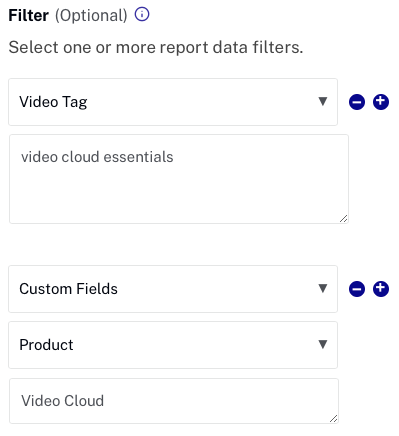
To add a filter, click the button. To remove a filter, click . The following values can be used as filters.
- Video - One or more active video IDs in the account
- Video Tag - One or more video tags
- Entering "financial services" (with the quotation marks) will return videos that are tagged financial services.
- When using multiple tags, videos with ALL the tags will be returned. Entering "financial services", accounting will return all videos that are tagged financial services and accounting.
- Note: the mechanism used to return videos by tag has no sort or paging options.
- Custom Fields - One or more custom fields in the account
- When filtering on custom fields and Select All is selected, the custom field list will include the custom fields from all of your accounts. As custom fields are selected, the list will be filtered to contain only custom fields that are common across all accounts.
- Player - The filter value will vary based upon the context you are searching for:
- Brightcove Players - Enter the player URL in this format: players.brightcove.com/account_id/playerID_default
- Brightcove Players used in SDK apps - Use the destination property from the app. The default value for the destination property is bcsdk:// followed by the app's bundle identifier as listed in the app's info.plist file.
- Source Type - One of the following values:
- Direct (bookmark, typed in URL, or link from email)
- Referral (direct link from some other page)
- Organic Search (ordinary search using some search engine)
- Paid Search (clicking a sponsored link in search results)
- Secure Search (search by a logged-in viewer)
- Device Type - Any of the following values:
- Mobile
- Tablet
- Connected TV/Game Console/Companion Device
- Desktop
- Other
- Device OS - Any of the following values:
- Android
- bada
- iOS
- BlackBerry
- Symbian
- Web OS
- Windows
- OS X
- Mac OS
- Linux
- Other
- Device Manufacturer - Any of the following values:
- Apple
- Amazon
- ASUS
- Blackberry
- Fujitsu
- Huawei
- HTC
- Kyocera
- Lenovo
- LG
- Micromax
- Microsoft
- Nintendo
- Panasonic
- Roku
- Samsung
- Sharp
- Sony
- Vizio
- ZTE
- Other
- Browser Type - Any of the following values:
- Chrome
- Edge
- Firefox
- Internet Explorer
- Opera
- Safari
- All Others
- Country - ISO-3611-1 2 letter country code
- Destination Domain - The domain(s) where a video_impression occurred
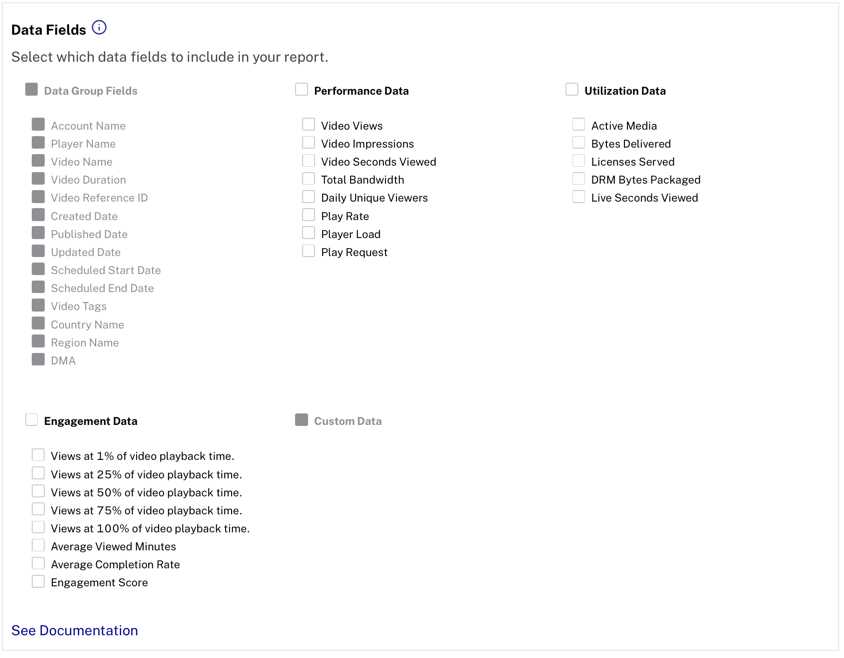
Selecting data fields
The Data Fields section is used to select the data values that will be included in the report. The list of data fields available is based upon the dimension(s) that were selected.
If the selected account is configured with custom fields, they can also be selected. If the report includes all accounts, all custom fields from those accounts will be displayed.
Previewing the report
The Preview Report section shows the data columns that have been selected, populated with sample data. Click a trash can icon to remove that data item from the report.
Configuring delivery options
Start by giving the report a meaningful name. This is especially important when creating a recurring report.
The Format section is used to select the format of the report data that is downloaded.
- CSV - comma-separated values
- XLSX - Microsoft Excel
Email notifications can be used to notify yourself and other users in your organization when the report is complete. Checking the E-mail me when my report is ready will send an email to the report requester when the report is complete. Additional people can be notified by adding their email addresses to the Notify others text field. When the report is complete, they will receive an email with a link to the report.
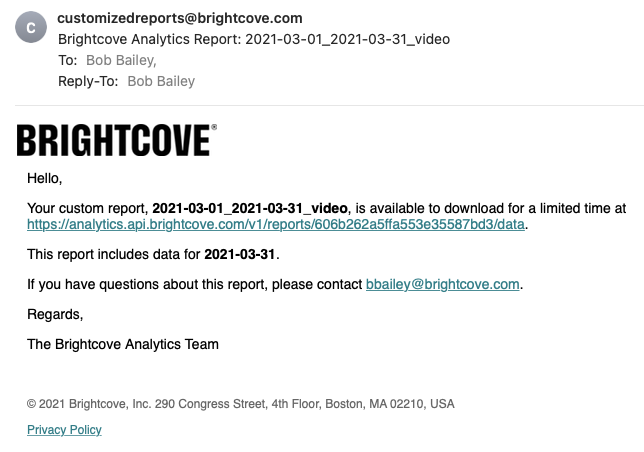
The link to download the report is valid for 90 days.
Requesting the report
Click the Request Report (for One-time reports) or Schedule Report (for Recurring reports) button to run the report. If the report is a One-time report, the report will be downloaded when it is complete. For Recurring reports, the report will be queued and run when the data is ready.
Viewing scheduled reports
To view all recurring reports, click Scheduled Reports in the left navigation. See Managing Scheduled Reports for more information on working with scheduled reports.
Quick Reports
The new Quick Reports feature allows you to quickly generate reports that provide viewer-level data.
How to Access It
From the Video Cloud Studio home page. Navigate to the Analytics module.
in the left side navigation menu.
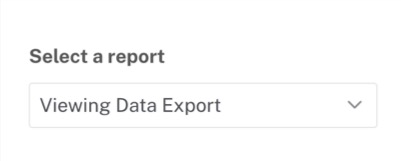
How to Use It
From the Quick Reports page, select the type of report from the dropdown menu.
Use the date picker to set the start and end dates for the report.

to generate the report.
Once the report is ready, a notification appears on the screen prompting you to download the CSV file.
Delete reports
The table on the UI includes aicon to remove any unneeded reports.
Troubleshooting
Missing or Partial Data
Data is typically processed within 48-72 hours and refreshed around 15:00 UTC. Running a report before this may result in missing or partial data for the last 48-72 hours. If you see missing data past 72 hours, please contact Brightcove Customer Support.
Running a report multiple times does not refresh data
Quick reports are cached for 3 hours. Running multiple reports with the same date range within this period will return the same report.
Live videos are not included in report
Currently, live videos are not included in the report because Brightcove cannot calculate accurate watch percentages for these events.
Limitations
- The account limit for Analytics reports is 250.
- Every user in the Enterprise Account is limited to 20 recurring reports.
- Every user in a Professional Account is limited to 5 recurring reports.
- Once a user unsubscribes from a scheduled report, they cannot resubscribe to receive that report again. To work around this limitation, you will need to duplicate the report and subscribe to the new copy.
- Reports exceeding 1M rows tend to fail depending on the number of dimensions it has to be aggregated on. Especially when:
- Including Data Groups Fields:
- Video Name
- Video Duration
- Reference ID
- Created Date
- Published Date
- Updated Date
- Scheduled Start Date
- Scheduled End Date
- Video Tags
- And/Or Filtering by:
- Video Tag
- Custom Fields
- Including Data Groups Fields: