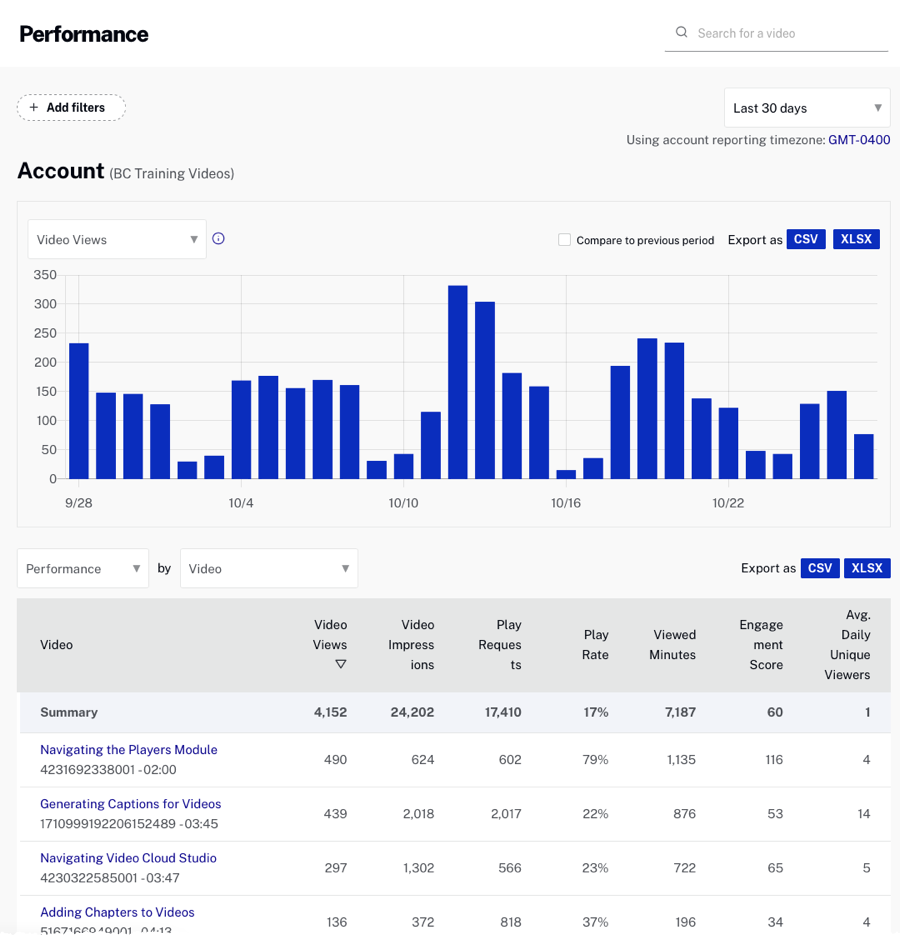
Performance Report
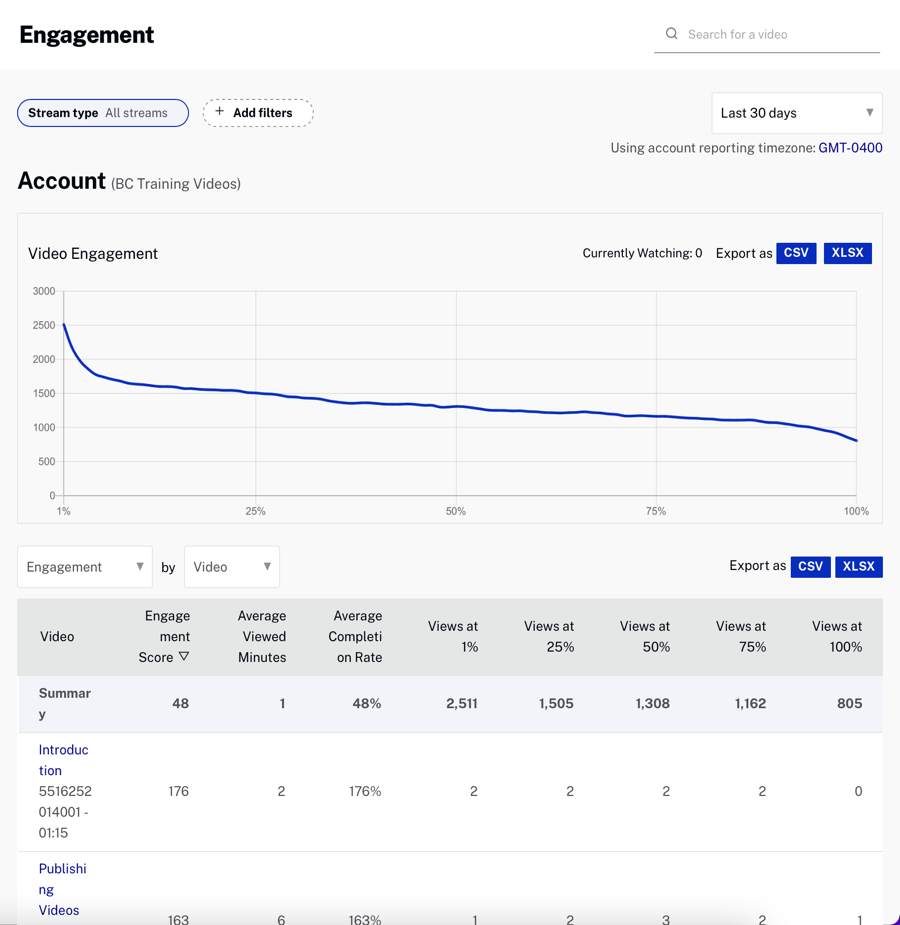
The Performance Report shows the performance for the videos in your account, including video views, videos impressions, play rate, viewed minutes and engagement score. The Performance Report allows the data to be segmented into dimensions:
- Video - Displays performance metrics on videos
- Player - Displays performance metrics on players
- Source of Traffic - Displays performance metrics based upon source of traffic
- Display Domain - Displays performance metrics based upon the domain the viewer was on when a video was viewed; if the player is in an iframe, the display domain will be recorded as the URL of the page in the iframe. (This corresponds to the
destination_domaindimension of the Analytics API.) - Country - Displays performance metrics based upon the country the video was viewed in
- Device - Displays performance metrics for each Device Type - Device Operating System combination that was used to view a video
- Device Type - Displays performance metrics by device type
- Device OS - Displays performance metrics by device operating system
- Device Manufacturer - Displays performance metrics by device manufacturer
- Browser Type - Displays performance metrics by browser type
- Day - Displays performance metrics based upon day
For detailed information on the Performance report, see the Performance Report Reference.