Introduction
Quality of Experience (QoE) analytics provide information to help understand the user's video streaming experience, including playback success, startup time, rebuffering, and visual quality.
QoE focuses on metrics that provide a sense of the viewing experience from a user's perspective. It is Brightcove's goal to provide customers with a transparent, meaningful, and well-curated set of metrics focused on the following:
-
Troubleshooting:
- Which devices and players have a lower quality of experience?
- Are issues related to the player, device, or geographic region?
- Can I mitigate these issues?
-
Reporting:
- How is my service performing across key QoE metrics?
- Are there trends that I should be aware of and address?
-
Monitoring:
- You can track video metrics that show how viewers are impacted.
For a list of QoE terms and definitions, see the Glossary section.
Setup
Brightcove QoE Analytics are available to Media Video Cloud customers at no extra charge. Contact your Customer Success Manager to enable your account.
QoE Insights
Brightcove QoE Insights builds on the analytics in this topic, and incorporates user engagement data to provide greater understanding of audience behavior. For details, see the Brightcove QoE Insights document.
Navigation
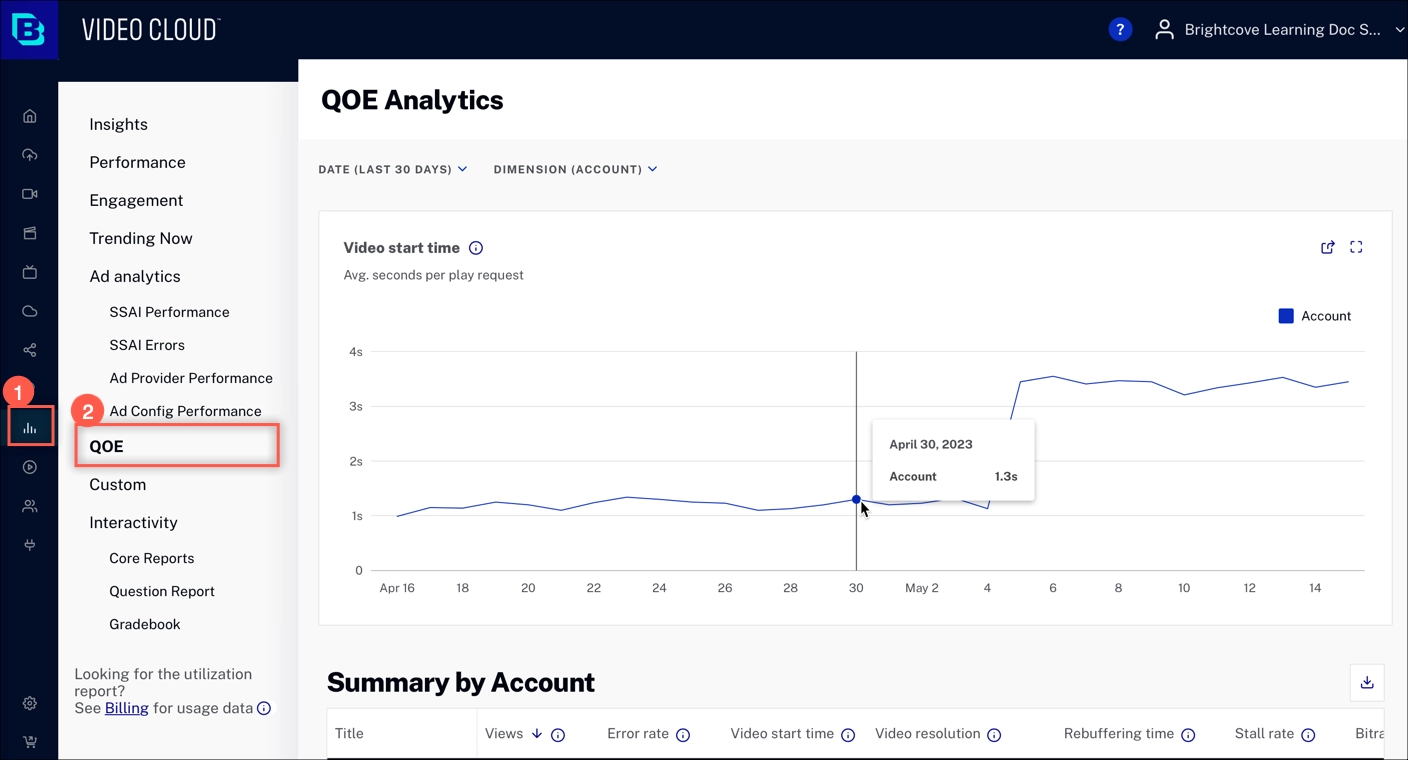
Once your account is enabled for QoE Analytics, you will find them in the Analytics module in Studio.
- Open Video Cloud Studio.
- In the primary navigation, click Analytics.
- In the panel navigation, click QOE.
Time range and dimensions
Use time range and dimension to filter the data displayed in the charts below.
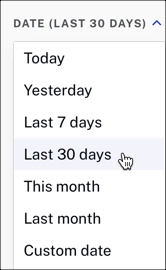
Time range selector
Click DATE to expand the dropdown menu. Select the time range for your reporting data. The charts below trend over time, based on the time range.
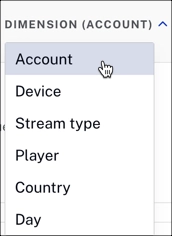
Dimension selector
Click DIMENSION to expand the dropdown menu. Select the measurement for your reporting data. When you select a dimension, it will be reflected in all of the charts described below.
Dimensions
Account
The Account view provides an overall number for all streams in your account across all platforms.
Device
The Device view makes it easier to see device-specific issues and trends over time. The example below shows a spike in error rate for Android devices that could correlate to a recent app update.
This graph shows the top 5 devices by view count, and the account level.
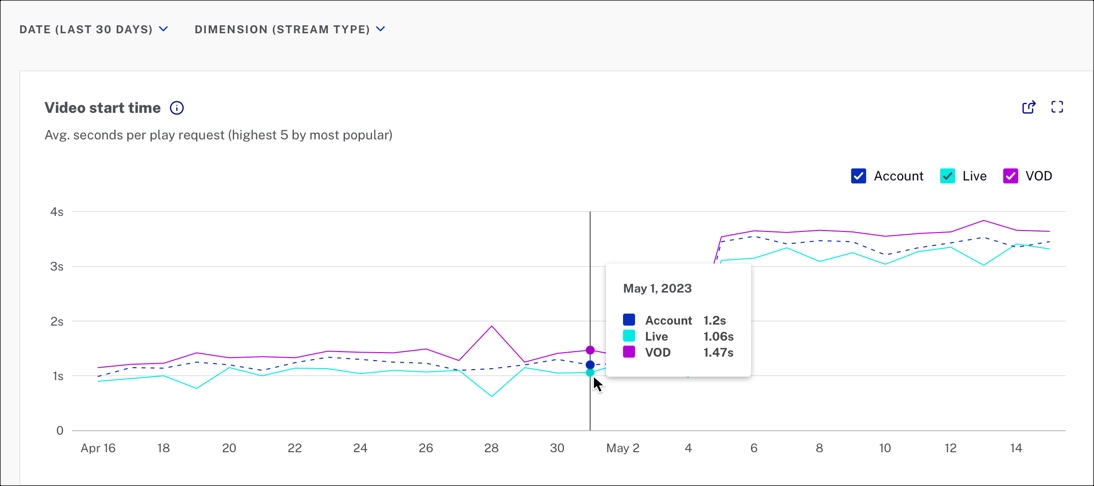
Stream type
The Stream type view compares all content in your account with VOD and Live metrics.
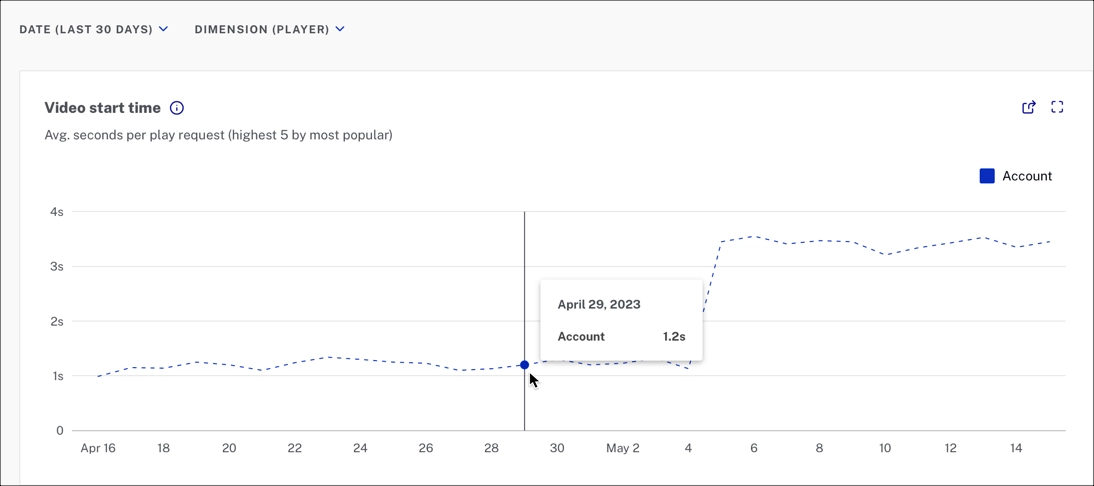
Player
The Player view shows specific players' performance and allows you to isolate and troubleshoot players where QoE is underperforming. Modifications to chunk size and buffer size can be measured using this metric.
This graph shows the top 5 players by view count, and the account level.
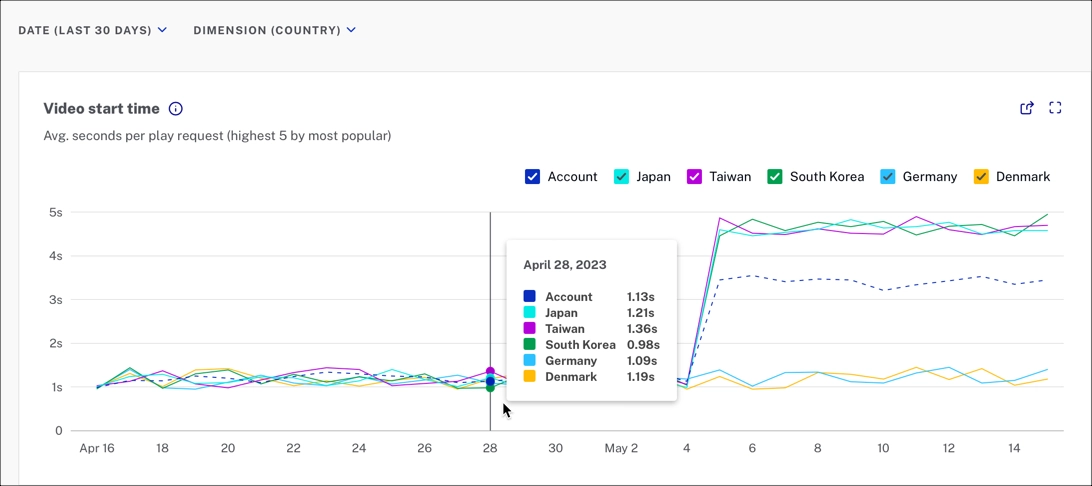
Country
For international customers, viewing QoE metrics by country can assist in isolating regional issues. In the fictional example below, the customer adopted a new content delivery network (CDN) for their Asian consumers. The chart shows that the CDN underperformed when looking at the stall rate.
This graph shows the top 5 countries by view count, and the account level.
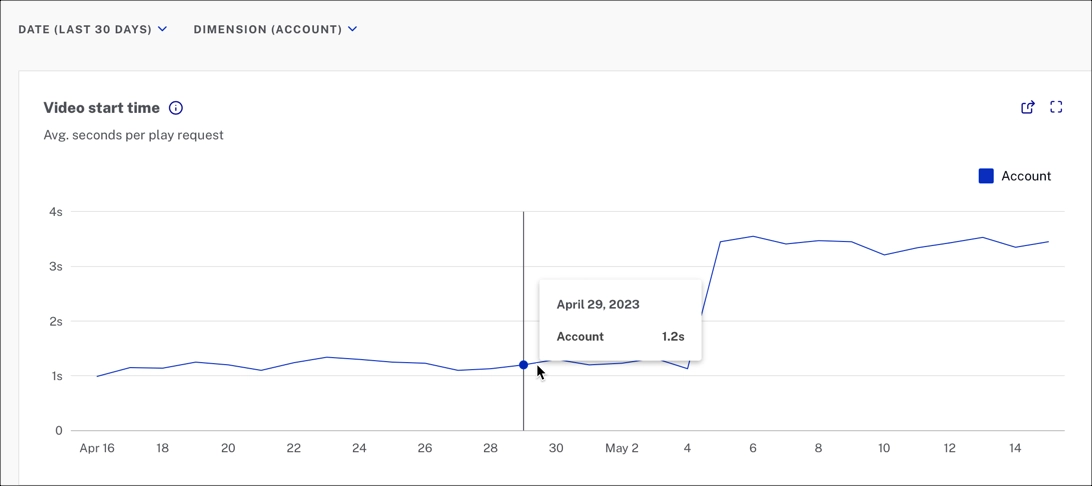
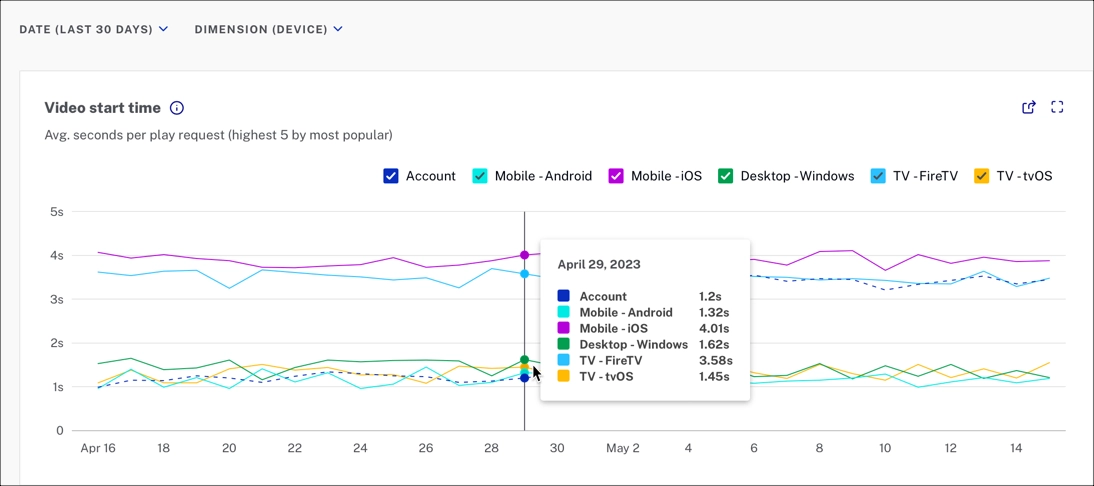
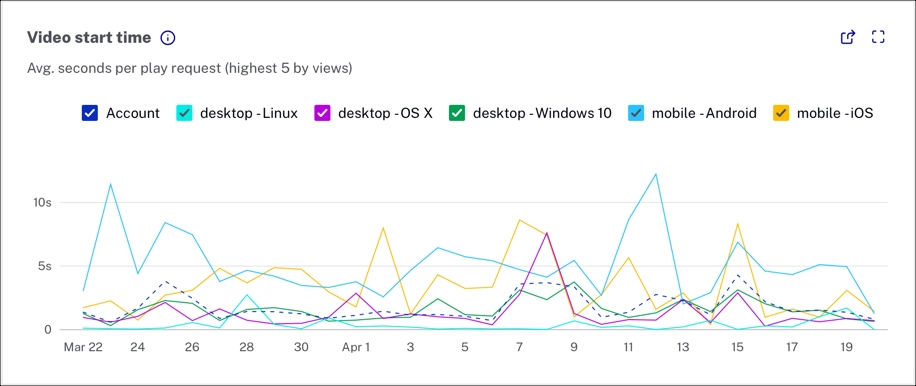
Video start time
The video start time is the average time between play request and stream start.
This metric is helpful because long load times cause abandonment before streaming starts. Long load times can point to issues with CDN, player plug-ins, and initial stream bitrate where intervention makes sense. Low video start times mean your viewers can start watching their videos quickly, which is what they expect.
This example shows the top 5 devices by view count, and the account level.
Summary table
The summary table makes it easy to explore and identify anomalies.
The date range and dimensions that you set for the page, also applies to the data in the summary table. For example, if you select the Device dimension, you will see a Summary by Device.
Summary by Device
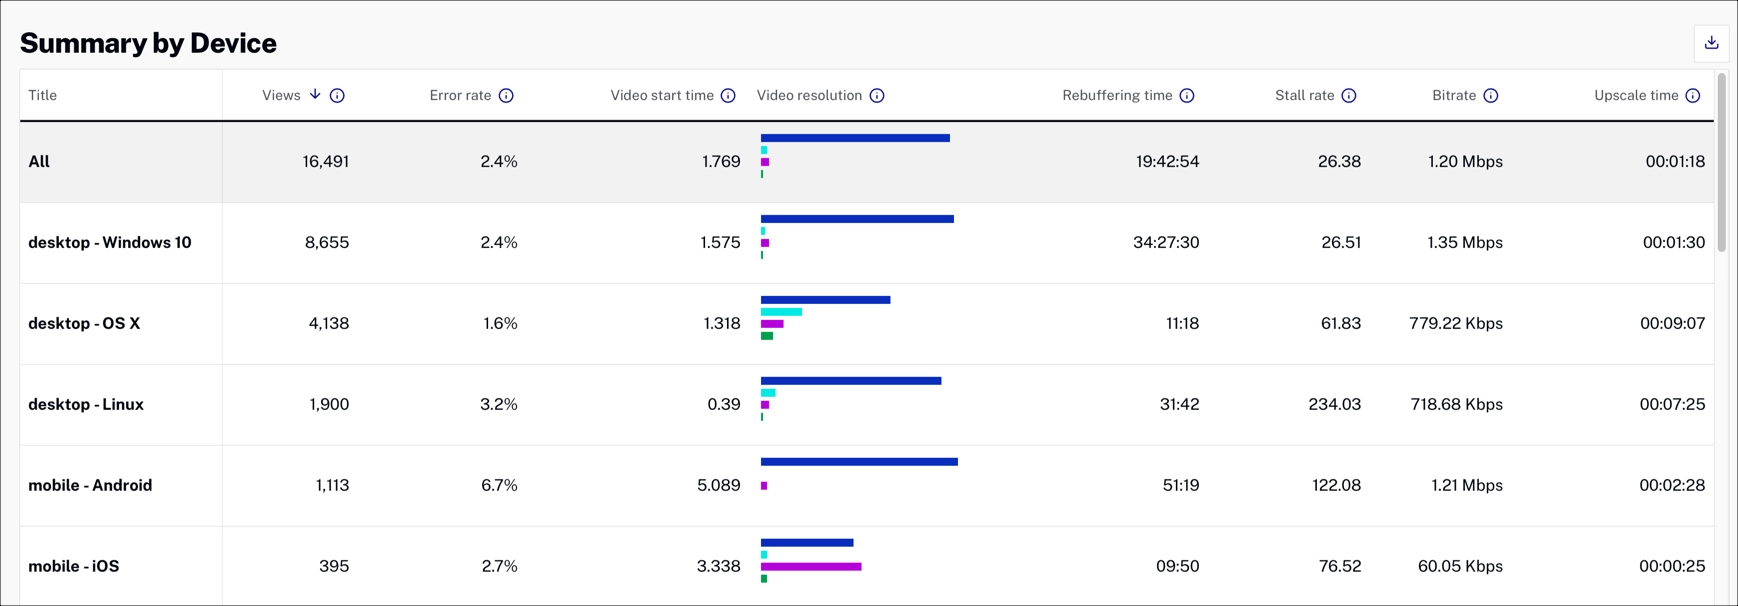
Each column is sortable. The default sort order is video views descending.
In addition to the key metrics, the summary table includes the following data:
- View count
- Video resolution breakdown
- Rebuffering time
- Avg Bitrate
For details about the column data, see the Glossary below.